Results Summary
Results Summary (by Product/International Sales)
Trend in Sales by Product Category
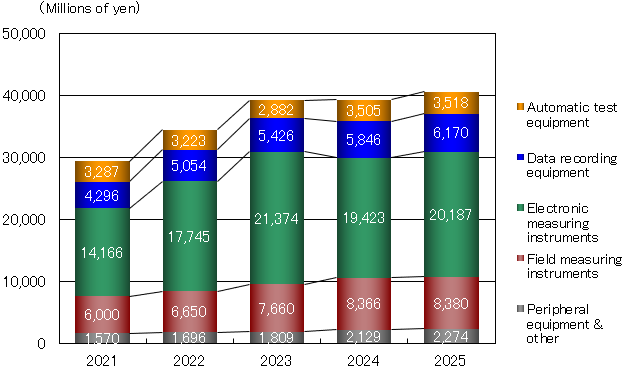
Percentage change by product category (year-on-year)
| 2021 | 2022 | 2023 | 2024 | 2025 | |
|---|---|---|---|---|---|
| Automatic test equipment | 172.3% | 98.1% | 89.4% | 121.6% | 100.4% |
| Data recording equipment | 115.1% | 117.6% | 107.4% | 107.7% | 105.5% |
| Electronic measuring instruments | 148.5% | 125.3% | 120.5% | 90.9% | 103.9% |
| Field measuring instruments | 115.9% | 110.8% | 115.2% | 109.2% | 100.2% |
| Other | 120.5% | 108.0% | 106.7% | 117.7% | 106.8% |
| Total | 135.3% | 117.2% | 113.9% | 100.3% | 103.2% |
International sales growth rate (year-on-year)
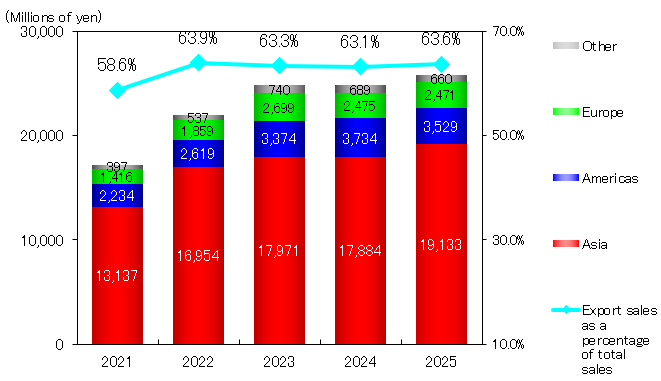
Overseas sales growth rate(year-on-year)
| 2021 | 2022 | 2023 | 2024 | 2025 | |
|---|---|---|---|---|---|
| Asia | 162.5% | 129.1% | 106.0% | 99.5% | 107.0% |
| America | 153.5% | 117.2% | 128.8% | 110.7% | 94.5% |
| Europe | 133.0% | 131.3% | 145.2% | 91.7% | 99.8% |
| Other | 107.6% | 135.3% | 137.8% | 93.1% | 95.8% |
| Total | 156.6% | 127.8% | 112.8% | 100.0% | 104.1% |