Financial highlights
Financial Data
(Millions of yen)
| 2021 | 2022 | 2023 | 2024 | 2025 | |
|---|---|---|---|---|---|
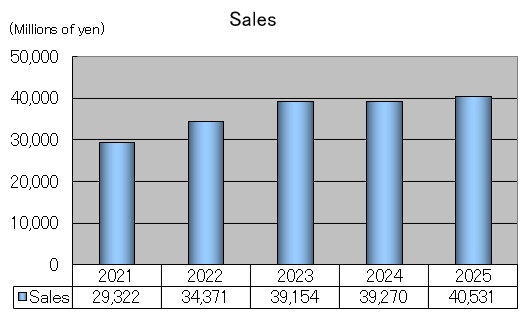
| Net Sales | 29,322 | 34,371 | 39,154 | 39,270 | 40,531 |
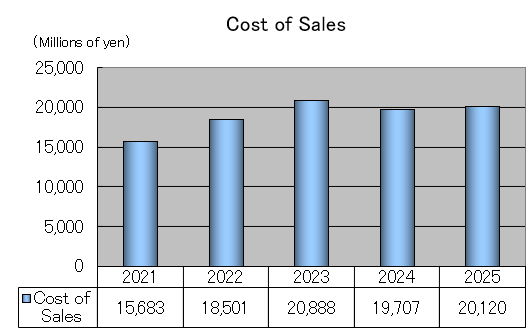
| Cost of Sales | 15,683 | 18,501 | 20,888 | 19,707 | 20,120 |
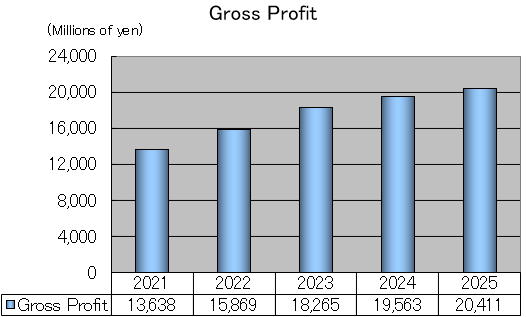
| Gross Profit | 13,638 | 15,869 | 18,265 | 19,563 | 20,411 |
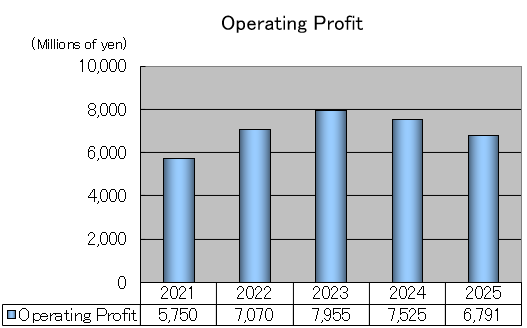
| Operating Profit | 5,750 | 7,070 | 7,955 | 7,525 | 6,791 |
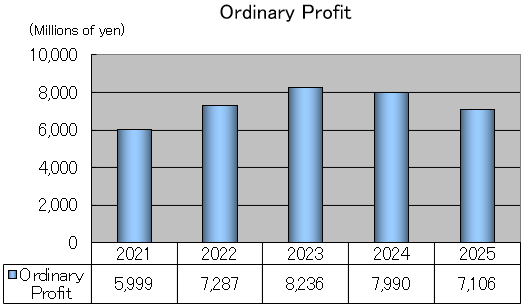
| Ordinary Profit | 5,999 | 7,287 | 8,236 | 7,990 | 7,106 |
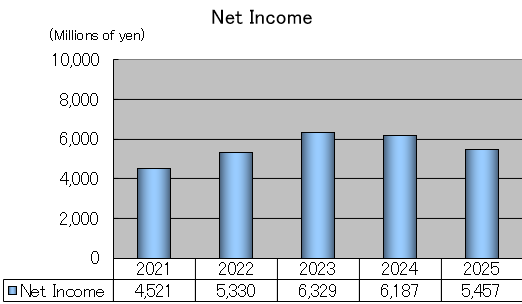
| Net Income | 4,521 | 5,330 | 6,329 | 6,187 | 5,457 |
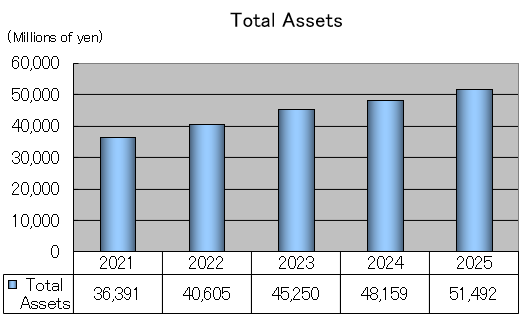
| Total Assets | 36,391 | 40,605 | 45,250 | 48,159 | 51,492 |
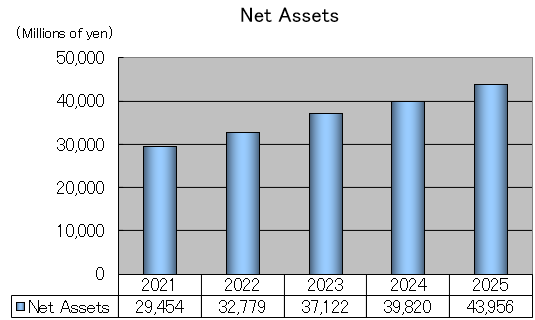
| Net Assets | 29,454 | 32,779 | 37,122 | 39,820 | 43,956 |
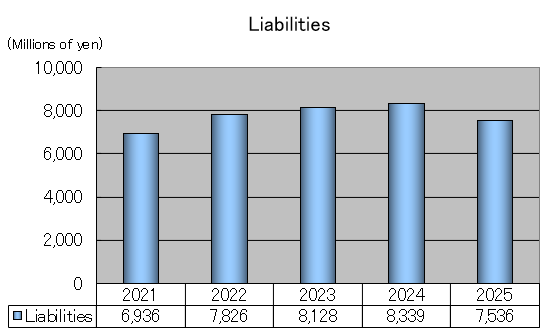
| Liabilities | 6,936 | 7,826 | 8,128 | 8,339 | 7,536 |
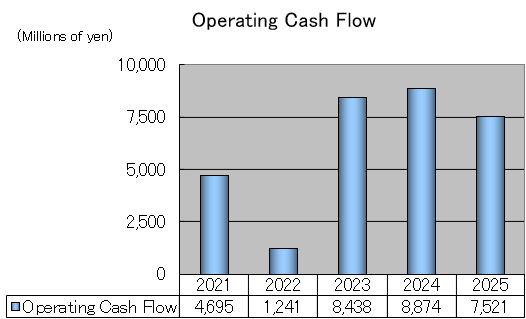
| Operating Cash Flow | 4,695 | 1,241 | 8,438 | 8,874 | 7,521 |
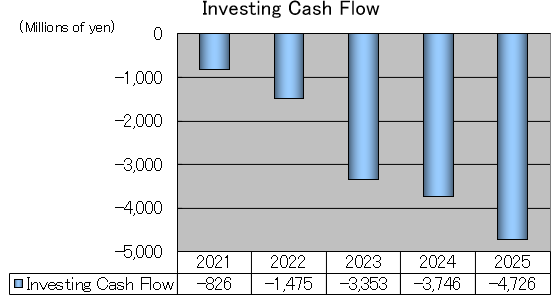
| Investing Cash Flow | −826 | −1,475 | −3,353 | −3,746 | −4,726 |
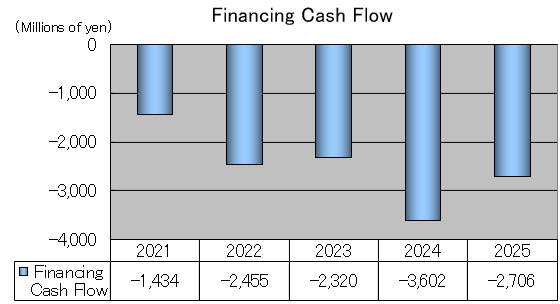
| Financing Cash Flow | −1,434 | −2,455 | −2,320 | −3,602 | −2,706 |
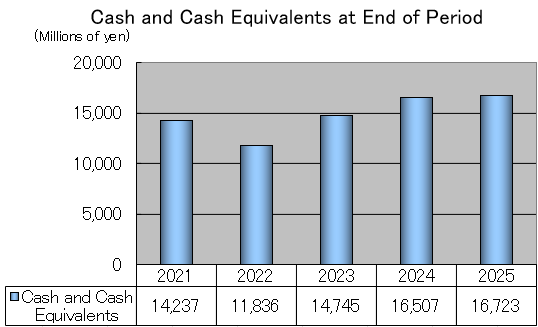
| Cash and Cash Equivalents at Period-End | 14,237 | 11,836 | 14,745 | 16,507 | 16,723 |
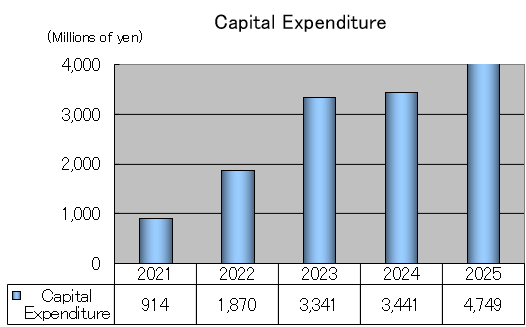
| Capital Expenditure | 914 | 1,870 | 3,341 | 3,441 | 4,749 |
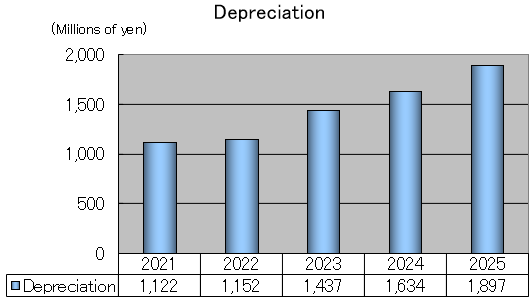
| Depreciation | 1,122 | 1,152 | 1,437 | 1,634 | 1,897 |
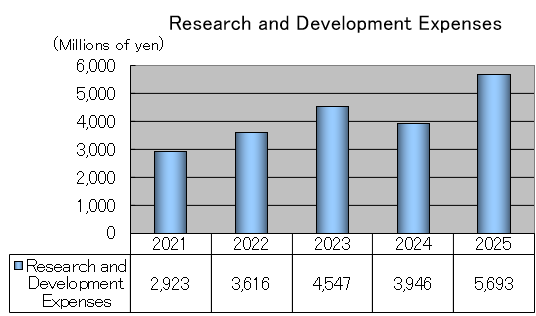
| R&D Expenses | 2,923 | 3,616 | 4,547 | 3,946 | 5,693 |