[LIB Electrode Slurry Analysis] Impedance Data Type that can be Analyzed
QWhat kind of impedance data can be analyzed by using the slurry analysis?
A
The system assumes that impedance data used will fulfill the conditions described below. You can determine whether a given set of impedance data satisfies the conditions by generating a Nyquist plot for the data. It's easy to generate Nyquist plots by Multi-plot.
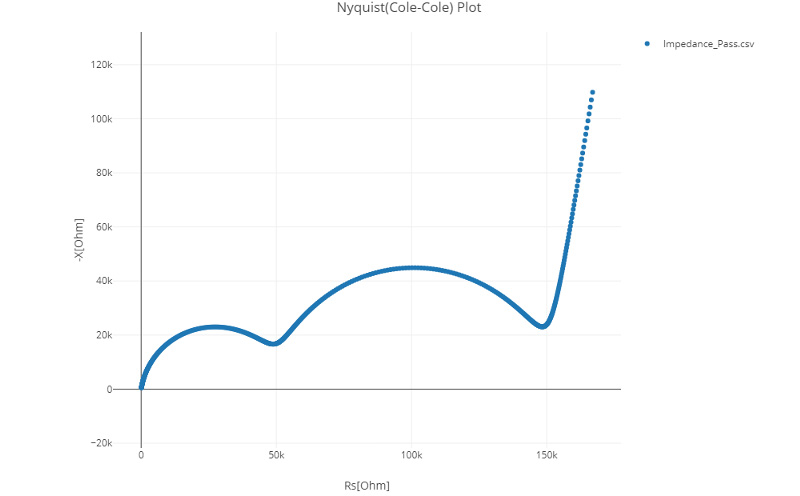
Image 1. Impedance data that can be analyzed
- The data must include several relaxation processes (when a Nyquist plot is displayed, you will see multiple arcs).
- Data with a measurement frequency of 1 kHz or greater must exhibit relaxation processes (when a Nyquist plot is displayed, the 1 kHz characteristics will make up part of the arcs).
- The boundary between the electrode cell’s electrode pins and the slurry must consist only of an electrical double-layer capacitance (when a Nyquist plot is displayed, the low-frequency side will consist of a straight line).
If a data that does not satisfy these following conditions may result in an analysis error.
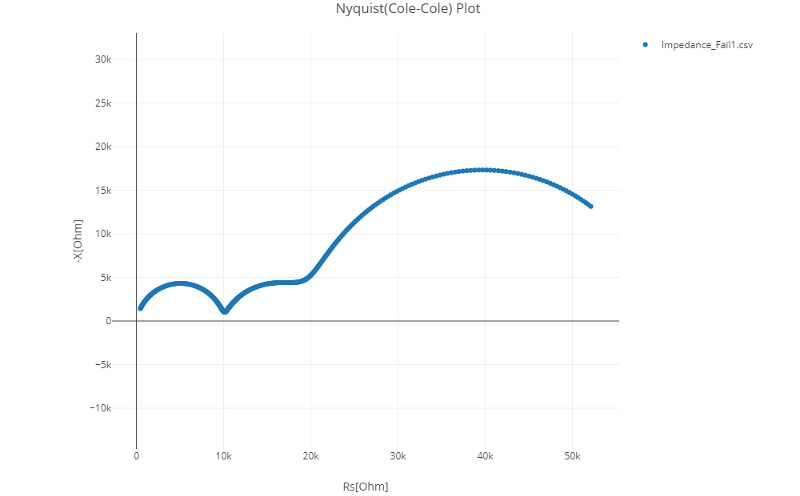
Image 2. Impedance data that cannot be analyzed: No. 1
The boundary between the electrode cell’s electrode pins and the slurry does not consist solely of the electrical double-layer capacitance (when a Nyquist plot is displayed, the low-frequency side is not a straight line).
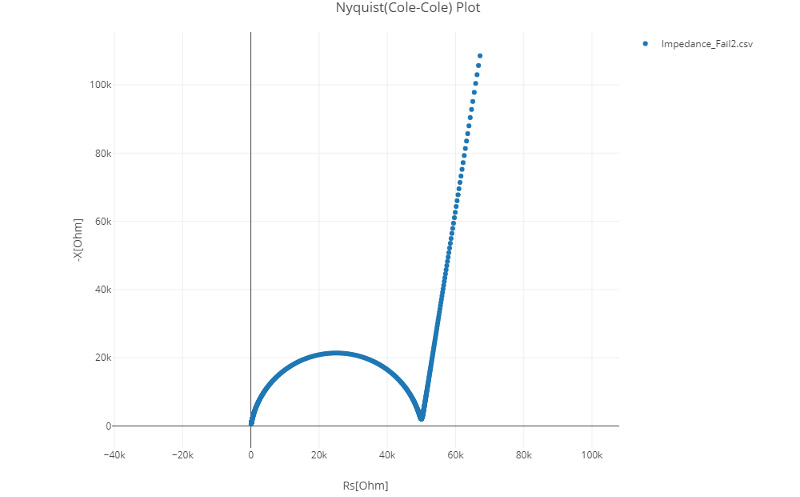
Image 3. Impedance data that cannot be analyzed: No. 2
It is a single relaxation process (when a Nyquist plot is displayed, you will see a single arc).
Related Resources
- Principles of LIB Electrode Slurry Analysis: Slurry Analytical System