[LIB Electrode Slurry Analysis] How to Identify Relaxation Processes from Conductive Materials
QIn slurry analysis, how are relaxation processes derived from conductive materials identified?
A
Relaxation processes are identified based on previously acquired frequency characteristics for relaxation processes derived from each material in the slurry.
It has been experimentally verified that relaxation processes vary by material.
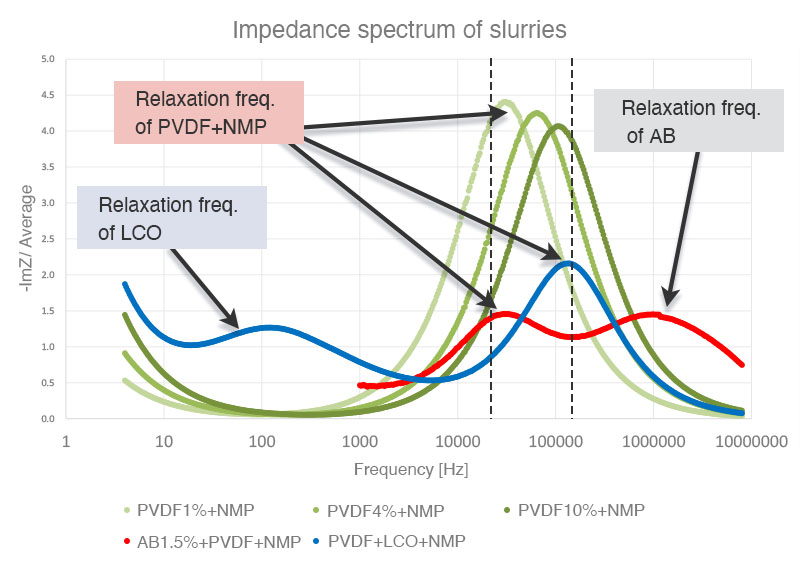
The waveforms shown below indicate the impedance spectrum for each of several slurries.
Measurement frequency is plotted on the horizontal axis, while the imaginary component of the impedance is plotted on the vertical axis.
The waveforms peak at the frequencies at which relaxation processes are detected.
The green waveforms were obtained from three binder solutions made by dissolving PVDF in NMP, each with a different concentration.
The red waveform indicates the results of dispersing acetylene black in the binder solution.
The blue waveform indicates the results of dispersing lithium cobalt oxide in the binder solution.
For each of the binder solutions that yielded the green waveforms, a single relaxation process is detected between 10 and 100 kHz.
The relaxation frequency increases with the PVDF concentration.
For the acetylene black dispersion that yielded the red waveform, a new relaxation process appears at several megahertz in addition to the binder solution’s relaxation process between 10 and 100 kHz.
For the lithium cobalt oxide dispersion that yielded the blue waveform, a relaxation process appears between 100 and 1000 Hz.
These results illustrate how the relaxation processes specific to a given material can be isolated and observed by means of impedance measurement that sweeps through a range of frequencies.
Related Resources
- Principles of LIB Electrode Slurry Analysis: Slurry Analytical System