Supporting the Future of Energy Conversion! Revolutionizing Thermal Management with High-Precision Simultaneous Power and Temperature Measurement
Introduction
From electric vehicles (EVs) to renewable energy systems and data centers, today’s energy-driven world demands precise control over power and temperature. For example, in power conditioning systems (PCS) development for solar power, engineers need to monitor power fluctuations and temperature changes to optimize efficiency and ensure reliability. Similarly, EV battery testing requires tracking temperature and power consumption during charge-discharge cycles to extend lifespan, increase efficiency, and enhance safety. In data centers, understanding server power usage alongside cooling performance prevents overheating and boosts efficiency. The solution? Simultaneous, high-precision measurement of power and temperature with one device during R&D. This approach streamlines thermal management, improves system performance, and saves time—perfect for R&D engineers looking to push energy conversion to the next level.

User benefits of tying together power and temperature measurement
Traditional methods using a power meter and a temperature logger, took up extra space in your lab and required manual data integration. That’s time-consuming and error-prone. HIOKI’s all-in-one solution measures power and temperature together, saving space, simplifying setups and analysis, and cutting costs. The result? Better system quality and reliability for smoother decelopment.
Separate temperature measurement (data logger) and power measurement (power analyzer), requiring users to integrate data manually.
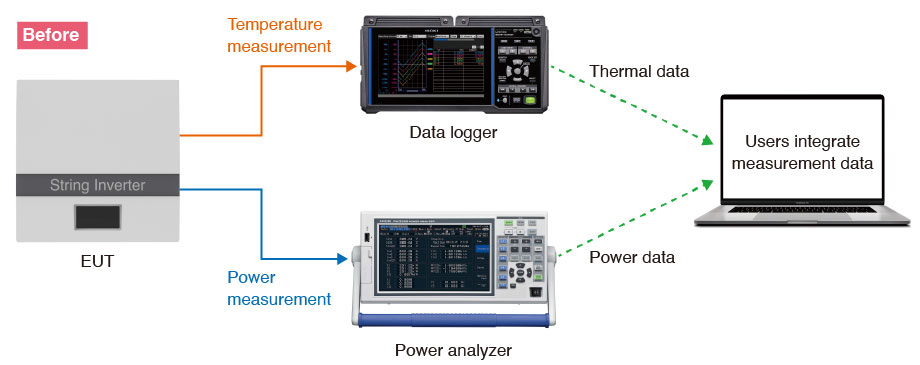
Examples of traditional power and temperature measurement
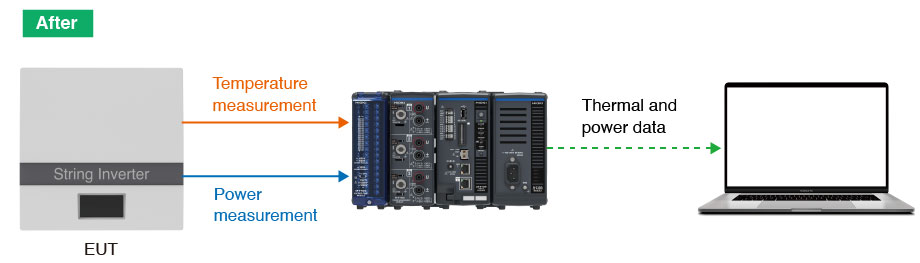
Integrated measurement with LR8101/LR8102, combining temperature and power data in one device.
Simultaneous measurement solution for power and temperature
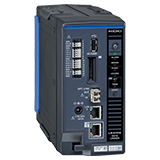
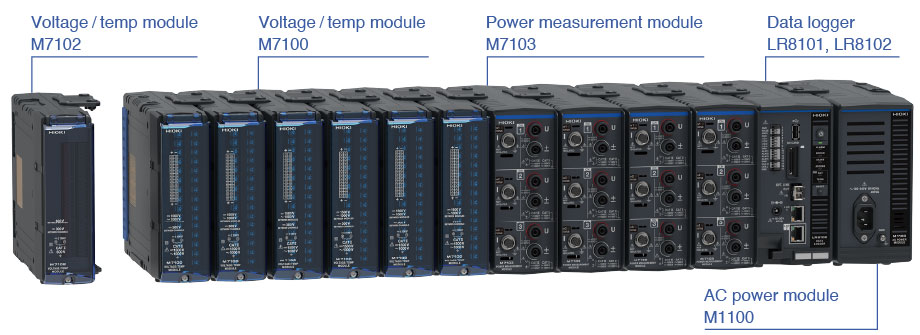
Integrated power and temperature measurement solution: data logger LR8100s series
Data logger LR8102 and modules for simultaneous power/temperature measurement.
These data loggers make real-time, simultaneous measurement of power and temperature a breeze.
- Scalability and versatility: 3000 channels for temperature (thermocouple), 120 channels for power
- High-precision power measurement: AC/DC ±(0.02% of reading + 0.05% of range)
- High-voltage measurement: DC 1500 V (accuracy guaranteed)
- High speed: data update interval of 5 ms
- Wide range of current sensors: clamp-type and through-type, supporting up to AC/DC 2000 A
Example of integrating power and temperature measurement
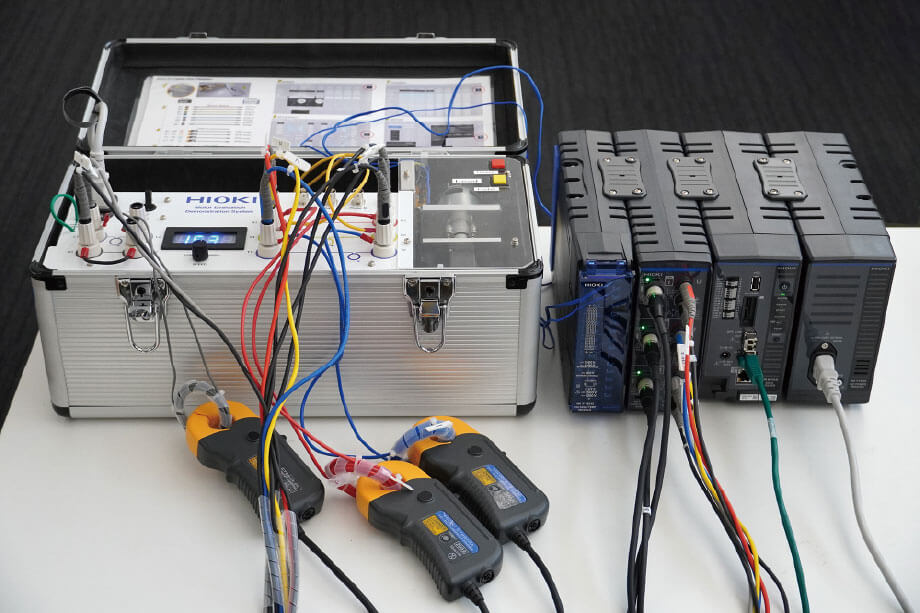
Let’s look at a practical example of measuring an inverter-motor unit’s power and temperature with Hioki’s logger LR8102.
The inverter’s input/output power and the load resistors’ temperature are measured simultaneously. The motor connects to light (RL) and heavy (RH) load resistors. When the switch is flipped, current flows through the resistors, increasing their temperature and the inverter's output power.
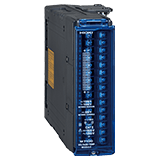
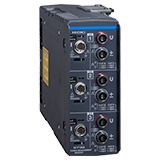
We measure power changes with the power module M7103 and temperature fluctuations with the temperature module M7100. The acquired data from both are integrated with the main logger LR8102 and sent to the free software Gennect Space for data acquisition and setting configuration.
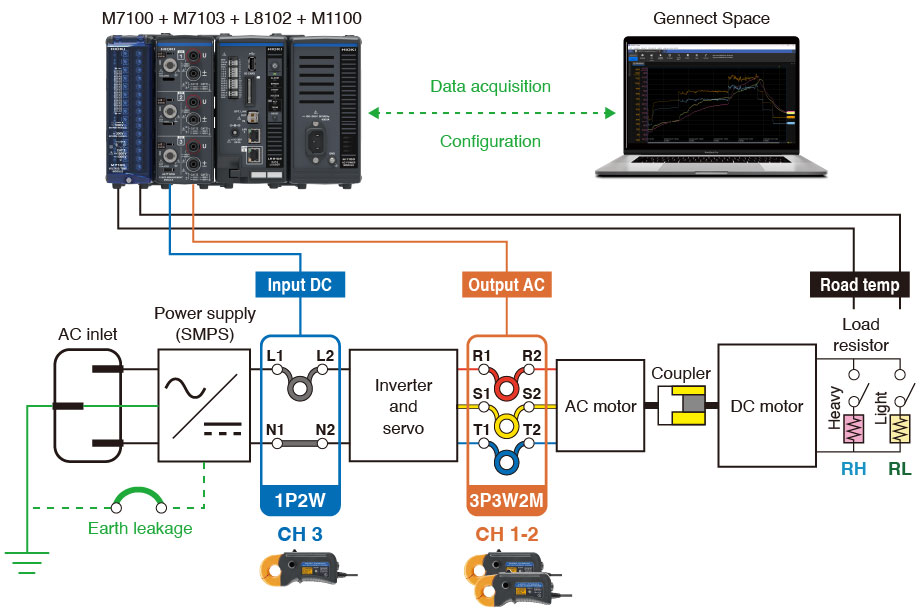
Inverter motor measurement connection diagram
Although omitted in this experiment, the Gennect Space's caluculation can quantify inverter efficiency, losses, integrated energy, and integrated energy loss.
The fluctuation of all of these power/loss data can be seen alongside temperature variations. Since energy loss and heat generation are directly linked, seeing them together is crucial for energy management.
Inverter efficiency : ηinv = P12 / P3
Inverter loss : Lossinv = P3 - P12
Inverter loss of integrated : Lossinteg = WP3 - WP12
P12 : Output AC power
P3 : Input DC power
WP12 : Sum of integrated positive and negative power values of output AC
WP3 : Sum of integrated positive and negative power values of input DC
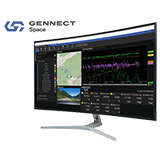
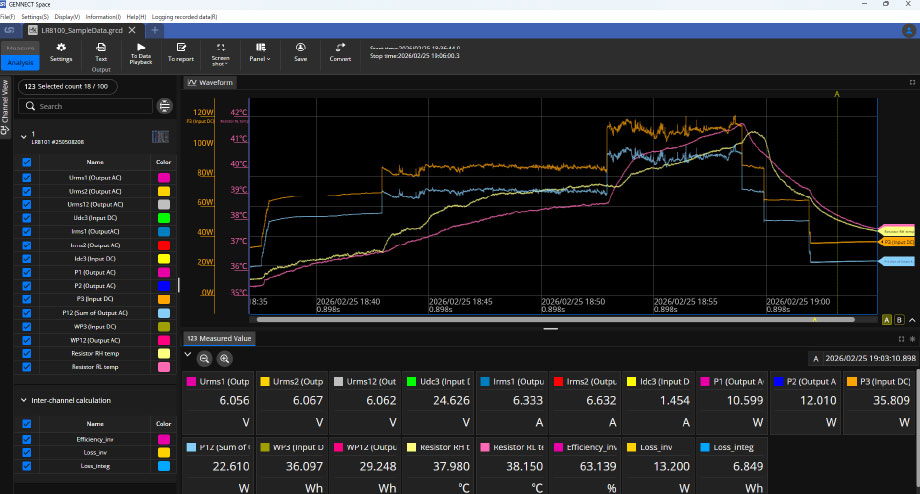
With Gennect Space, you can simultaneously and in real-time measure time-series data and numerical values for power and temperature. The measured time-series data can be freely analyzed within Gennect Space, and settings for the data logger and modules are easily adjustable.
Data measured with Gennect Space can be exported as a CSV file. By selecting the key items, you can output them for detailed analysis. In this example, we graphed the inverter's input and output power and the load resistors’ temperature to see effects of motor load changes. As the load increased, so did the power and temperature—just as you would expect.
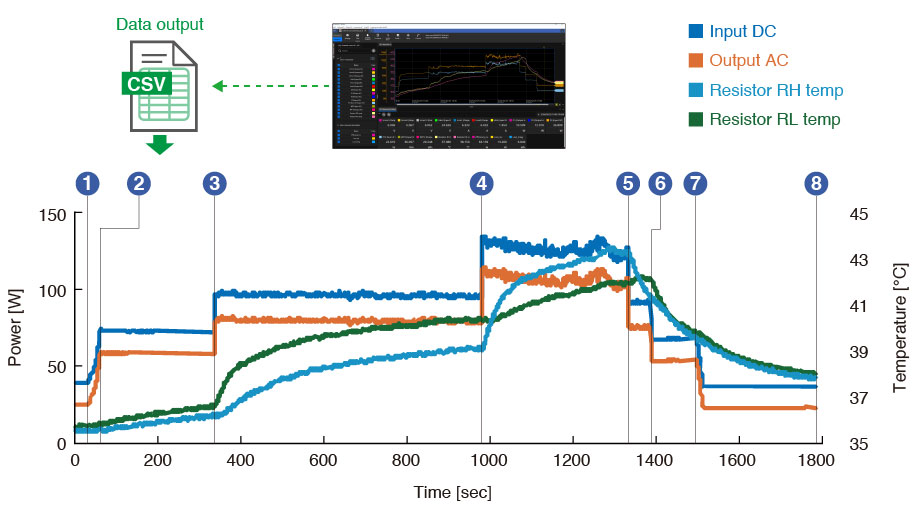
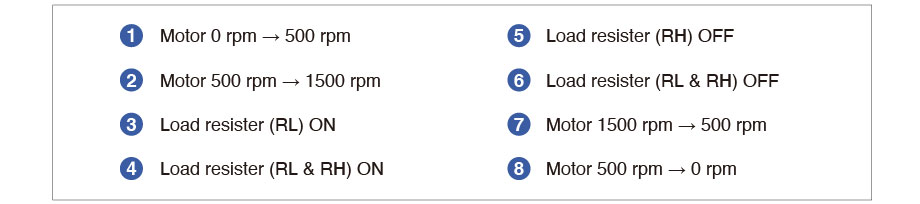
Dynamic changes in inverter input/output power and load resistance temperature
Conclusion
This application note showed how to perform high-precision, simultaneous measurement of power and temperature with the data logger LR8101 or LR8102. Paired with the power measurement module M7103 and temperature module M7100, these loggers can accurately measure fluctuations in input/output power of inverter motors and the temperature resistors. Unlike the traditional method which required manual data integration, this simultaneous solution makes analysis easy and consistent.
We encourage you to leverage this solution to effectively improve system quality and reliability for more efficient operation.