Winding/Coil Evaluation By L/R Values in Surge Testing
Introduction
Surge testing, also known as impulse winding testing, is used for inspecting windings of transformers, motors, and other devices. Surge testing involves applying an impulse voltage to the winding and acquiring the response waveform. The response waveform of the tested product is then compared with the response waveform of a good product (master waveform) to determine whether the tested product is good or defective. However, conventional waveform comparison methods often present challenges such as unclear distinctions in response waveforms, making definitive judgments difficult and hindering the precise identification of fault causes. Furthermore, as it relies on relative comparison with a master waveform, the process of setting and updating criteria can be cumbersome.
This application note proposes a new approach to address these challenges: estimating the equivalent circuit constants (L and R values) based on captured waveforms vis surge testing and subsequently using these numerical values for pass/fail judgments. This method offers a more objective and efficient means of coil evaluation compared to traditional waveform comparison techniques.
Challenges in conventional waveform judgment
Let's delve into the specific challenges encountered with traditional waveform judgment methods in surge testing.
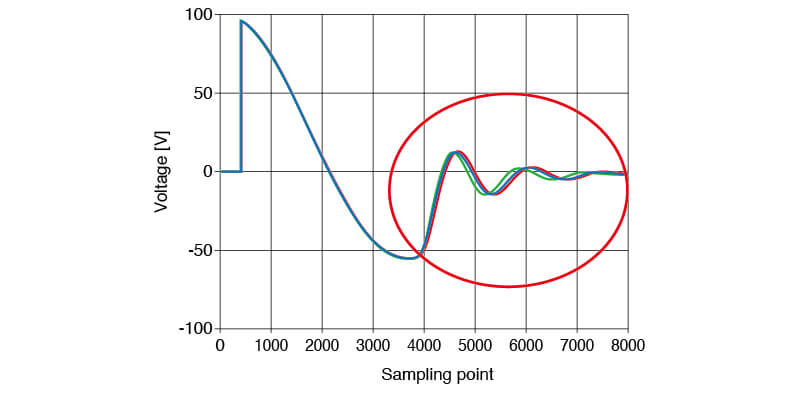
Fig. 1 Comparison of response waveforms
Fig. 1 shows the response waveforms when an impulse is applied between each phase of a three-phase motor that is in good condition. When testing a good motor, all waveforms should ideally overlap neatly to form a single line. But in reality, it is common for the variations to cause wiring response waveforms to vary (see the red circle in Fig. 1). Consequently, to determine pass/fail by comparing waveforms, it is necessary to observe the response waveforms of multiple good products, statistically determine the range of variation, and judge whether the waveforms deviate from this range.
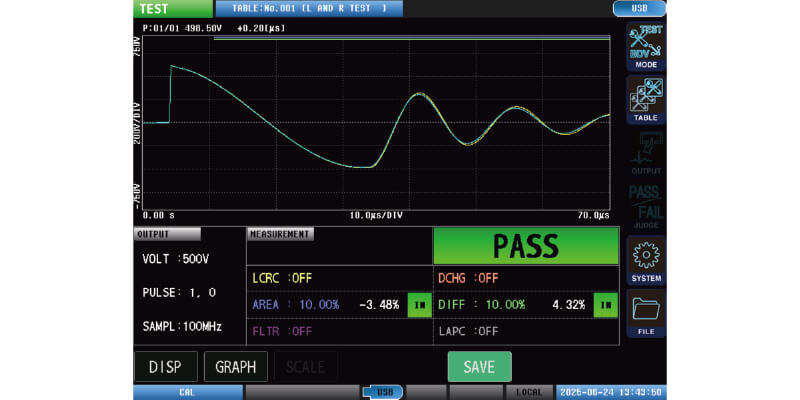
Fig. 2 Response waveform of a one-turn short (0.5 Ω)
Fig. 2 shows the response waveforms observed by Hioki's ST4030A before and after shorting the windings of a stator with a 0.5 Ω resistor. The yellow waveform is the response before the short circuit, and the blue waveform is the response after the short circuit (defective sample with one layer short). However, the waveform difference is minimal. At this level of difference, it is clearly difficult to distinguish between good and defective samples based on waveform comparison. This inherent limitation renders conventional waveform comparison (including comparison of the areas enclosed by the waveforms) insufficient for reliable defect detection.
Solution: L/R value estimation
To overcome the limitations of waveform comparison, this application note presents a numerical evaluation method.
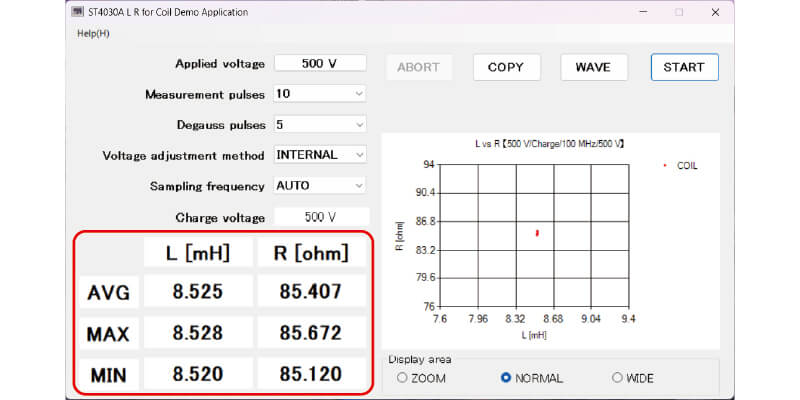
Fig. 3a Good product: Yellow waveform in Fig. 2
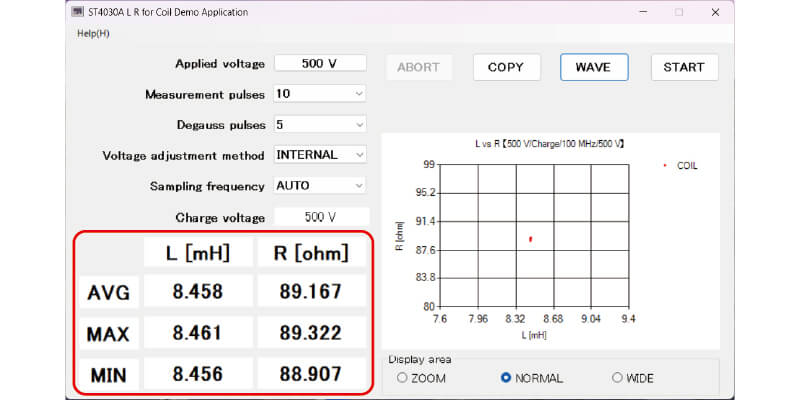
Fig. 3b Defective product: Blue waveform in Fig. 2
Fig. 3 Measure L and R of a good product (yellow waveform) and a bad product (blue waveform) in Fig. 2
Fig. 3 shows the L and R values characterized with this application software. Fig. 3a shows data for a good product (yellow waveform in Fig. 2), while fig. 3b shows data for a defective product (blue waveform in Fig. 2). As you can see, the values for the defective product are clearly different from those of the good product. By estimating and comparing the circuit constants of the test samples in this way, it is easier to determine whether a product is good or defective than by simply comparing waveforms. Below, we will explain the basic measurement principle and advantages of L/R value numerical comparison.
Principal
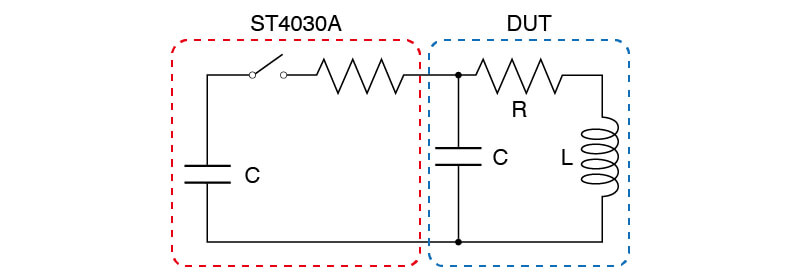
Fig. 4 Measurement equivalent circuit
Fig. 4 shows the measurement equivalent circuit of the test equipment (ST4030A) and device under test (DUT) used in this application. The voltage charged to C on the measuring device (in this case, ST4030A) is applied to the DUT by a switch, and the voltage response waveform at that time is acquired.
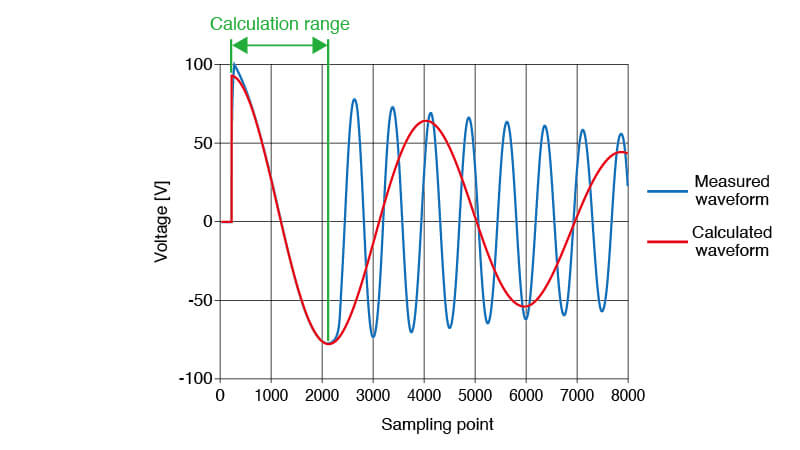
Fig. 5 Example of response waveforms
Fig. 5 shows the response waveform when the DUT was tested, with an impulse voltage of 100 V applied. The decay portion following the peak of the response waveform is used to fit the differential equation based on the equivalent circuit shown in Fig. 4. The values of L and R are estimated using the least squares method. Subsequently, curve fitting is performed to determine the appropriate constants.
Depending on the DUT, the response waveform may not oscillate. But since the initial decay portion of the waveform is used for calculation (see "calculation range" in Fig. 5), the L and R values can be calculated even for waveforms that do not oscillate.
Note that the values of L and R that are calculated here differ from those measured with an LCR meter. There are a few reasons for these differences. A key reason is that the actual characteristics of the DUT may not be precisely represented in the equivalent circuit used in calculation. Also, the magnitude of the voltage applied differs between an LCR meter and impulse winding tester (with the LCR meter using a significantly smaller voltage). This causes discrepancies between the measurement values. On the other hand, when the DUT's characteristics are close to the assumed equivalent circuit and the measurement frequency of the LCR meter is close to the first cycle of the impulse waveform, the difference in measurement values becomes smaller.
Advantages
Below are the advantages of L-value/R-value estimation.
- Clearer judgment and enhanced understanding
Comparing numerical circuit constants simplifies pass/fail judgments compared to waveform analysis. As the test results are presented as circuit constants directly reflecting the DUT's condition, the nature of any anomaly becomes easier to understand, improving the objectivity of quality decisions. - Simplified measurement and reduced test time
The elimination of master waveform registration streamlines the measurement setup, contributing to significant reductions in test time. The minimum required setting is only the applied voltage. Additional settings, such as increasing the number of measurement pulses for DUTs with large value variations or automatically adjusting the voltage for significant voltage drops, are also available. - Enhanced analysis and trend monitoring
Given that measurement conditions are controlled, this new numeric data will continue to accumulate. It is a clear advantage that the meaningful data of L and R values can be stored and used for any future use. Although waveform difference data could be stored to get a rough idea of manufacturing variation, the meaningful nature of the L/R data means that analysis will be more accurate and directly tied to known performance characteristics. In short, L and R values make test measurements valuable and worth storing for macro trend analysis and insights into improvement of windings.
Conclusion
The traditional method of testing windings has relied on waveform analysis. However, this method has one main flaw: although the impulse waveform is influenced by equivalent circuit constants of the winding, these constants could not be extracted from the waveform. This issue resulted in the necessity to compare a DUT's impulse waveform to that of a known-good sample, without any assurances as to whether the differences were good or bad. Hioki's dedicated software to the ST4030A solves this problem. It provides the circuit constants L and R, making judgements easier and with direct connection to performance of windings. Furthermore, the numeric nature of this measurement provides many additional benefits such as robust thresholds, flexibility in testing, and long-term utilization of data.
Through innovative solutions like the L/R value testing, Hioki continues to provide its partners with sustainable and profitable tools.
For detailed product information, please visit our website.
For a demonstration or consultation on a specific application, please contact us using our contact form.
Download of sample data
The Inductance and Resistance estimation demo application for coil can be downloaded here.