Mastering Probing for Accurate Low Resistance Measurements
Why is low-resistance measurement important?
High-current applications, like hybrid and electric vehicles, demand accurate low-resistance measurements to ensure efficiency and safety. Minor resistance in busbars or joints can cause heat buildup, reducing performance. Inaccurate measurements can lead to costly inefficiencies or safety risks.
Hioki's resistance meters RM3545A and RM3546, with a resolution of 1 nΩ and a measurement accuracy of 100 nΩ (when measuring resistances below 1 μΩ) , enables accurate testing. In spite of this accuracy, customers report differences between the measured and theoretical resistance values. Usually this is a result of probing.
This article explains the effect of probing on measured resistance values and describes best practices of probing for successful low resistance measurement.
Basics of low resistance measurement: What is 4-terminal measurement?
When measuring low resistance values, the resistance of measurement cables and the contact resistance of the probes cannot be neglected. The 4-terminal method eliminates these issues. A constant current (I) is applied to the device under test (DUT) from a SOURCE as shown in Fig. 1. The current causes a voltage drop V across the DUT. This voltage is detected at the SENSE line. Based on Ohm's law the resistance of the DUT R is R = V/I. The 4-terminal measurement (aka. Kelvin method) separates the current application path and the voltage detection path, thereby eliminating the influence of path resistance (equal to wiring resistance + contact resistance), and provides reliable results for low-resistance measurements. (For more information on the 4-terminal method, please refer to pages 8–9 of the “Resistance Measurement Handbook”1.)
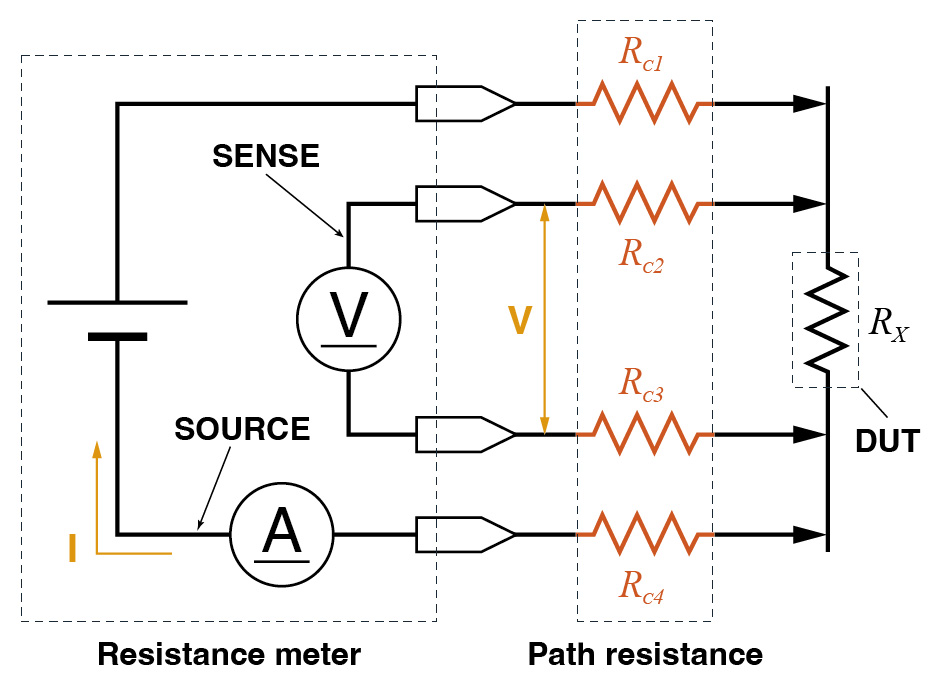 Fig. 1 Wiring diagram of a 4-terminal resistance meter
The effect of probing on measurement
In low resistance measurements, the probing method has a significant impact on the measurement results. The difference between the ideal current flow (uniform current density) and the actual current flow (non-uniform current density) during measurement is the main cause of measurement errors. Here, we will use chip resistors (surface mount resistors) and metal rods as examples to examine in detail the flow of measurement current and its effect on measurement values under ideal conditions and during actual measurement.
Current flow in ideal state
Chip resistors are typically mounted on printed circuit boards (PCBs), and manufacturers specify resistance values based on this mounted condition. For accurate measurements, the current applied to measure resistance would ideally flow uniformly through the chip resistor, as seen in fig. 2. Uniform current creates consistent voltage levels across the resistor, visualized as equipotential lines—lines of equal voltage perpendicular to the current flow. By measuring this voltage between the resistor’s electrodes, a resistance meter calculates the resistance value using Ohm’s law (R = V / I). For a uniform solid rod, the resistance R is given by R = ρ × L / A, where ρ is resistivity, L is length, and A is cross-sectional area, assuming uniform current flow.
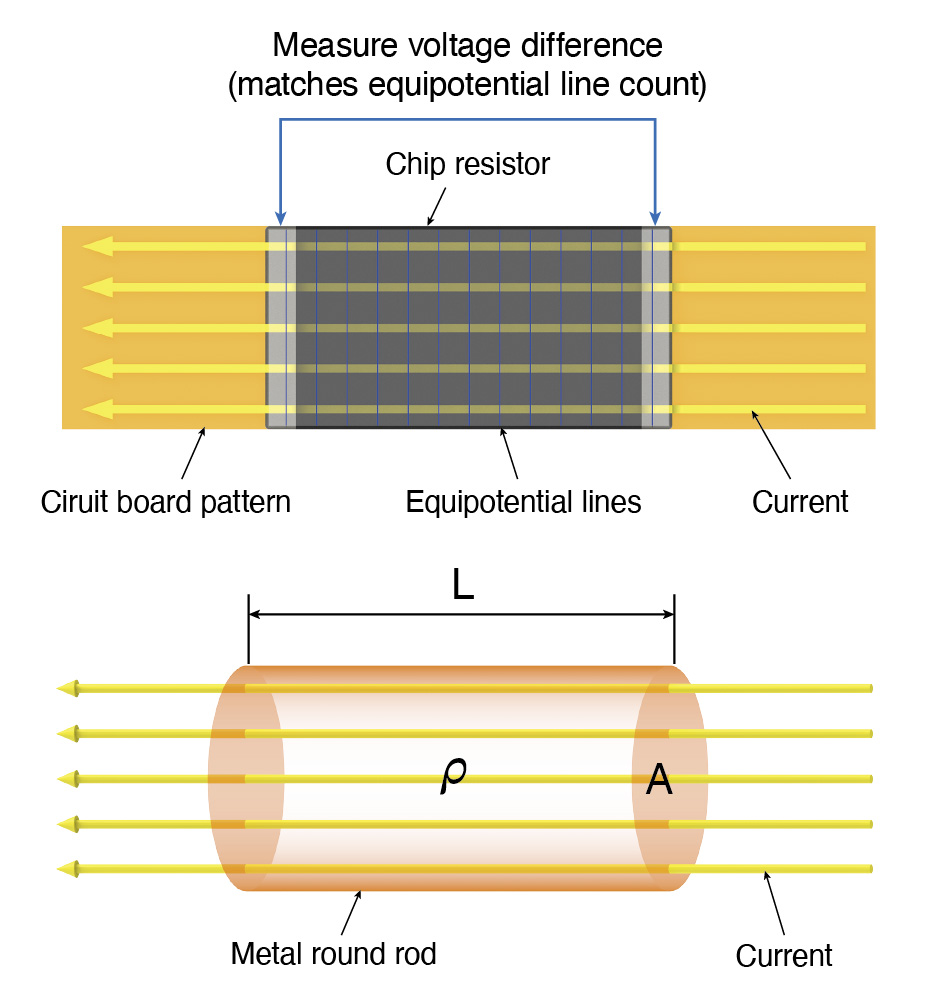 Fig. 2 Current flow (ideal state)
Current flow in actual measurement
Fig. 3 shows the actual current flow when probing low-resistance chip resistors, high-resistance chip resistors, and metal round rods, highlighting deviations from the ideal state.
- For low-resistance chip resistors, current spreads radially between electrodes, flowing unevenly compared to the uniform circuit board-mounted state, leading to measurement inaccuracies.
- For high-resistance chip resistors, current diffuses in the electrodes first due to the resistance difference between the electrode and the resistive element. This results in near-uniform flow similar to circuit board mounting.
- For metal round rods, current spreads radially from the probing point, matching the low-resistance chip’s path, flowing unevenly compared to the ideal state, causing measurement inaccuracies.
These deviations from the ideal current flow cause differences in the measured resistance value from the theoretical resistance value or from the value in the component specification.
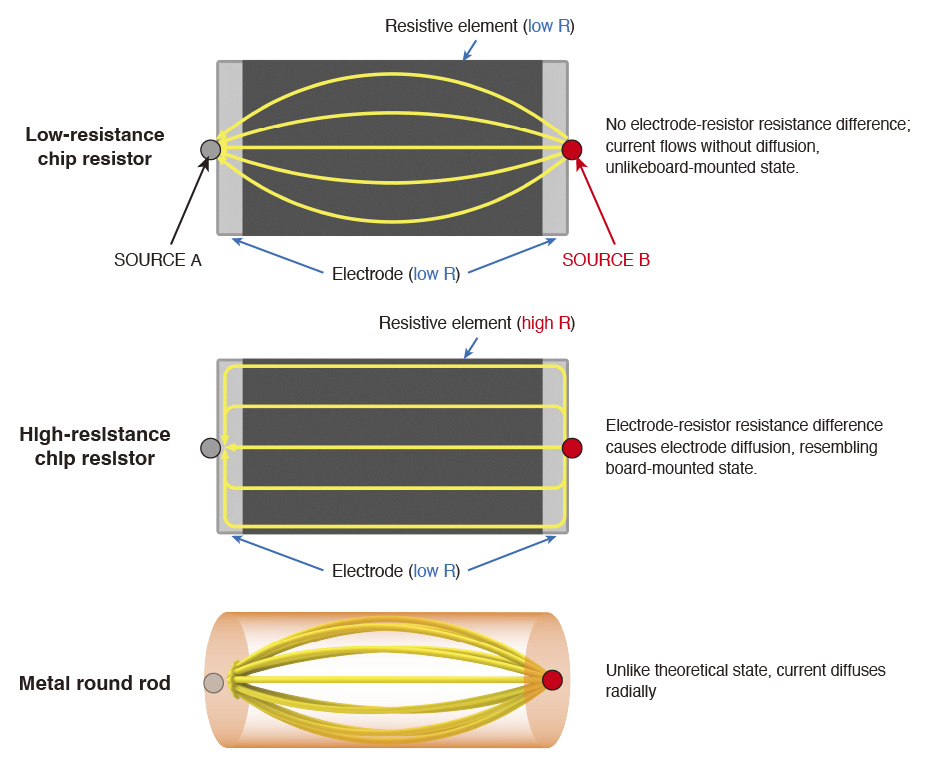
Fig. 3 Current flow (during probing)
Specific impact of probing on measured values
Impact 1: Discrepancy between specification/theoretical values and measured values
As shown in fig. 4, probing a low-resistance DUT, like a chip resistor or metal rod, causes uneven current flow, with high current density near SOURCE probes and no flow at the component’s corners. This differs from the ideal state (fig. 2). Since areas without current flow cannot be measured, the measured values will differ from the component’s actual electrical resistance, and as a result, the specification values (for chip resistors on circuit boards) and theoretical values (for metal rods).
This is because the effective DUT cross-sectional area becomes smaller (see “Only this area is measured” in fig. 4), like a reduced A in ρ×L / A.
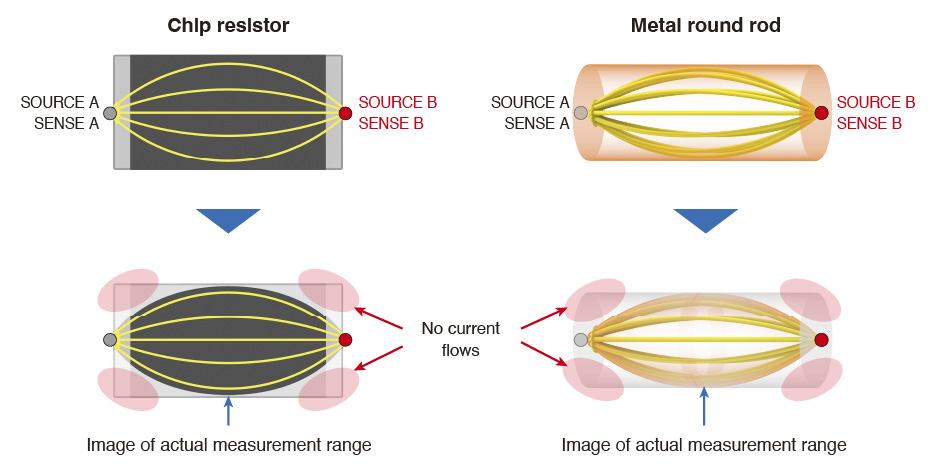
Fig. 4 Uneven current density
Impact 2: Measurement values vary with probing position
Let's consider a low-resistance chip resistor as an example. When measured under conditions of uneven current density, the spacing between equipotential lines becomes narrower around the SOURCE point, where the current density is high.
Let's assume that the equipotential lines are spaced at 1 mV intervals and that the distance between SOURCE A and SENSE A shifts by 1 mm for each probing.
As shown in fig. 5, even a 1 mm offset in the distance between SENSE and SOURCE causes differences in the measured voltage. Since the detection voltage is converted to a resistance value, this directly results in a variation in the resistance value.
In other words, the larger the SENSE-SOURCE distance, the smaller the change in detection voltage even if the probing position shifts, thereby suppressing variations in resistance values. As a result, measurement repeatability is improved as shown in fig. 6.
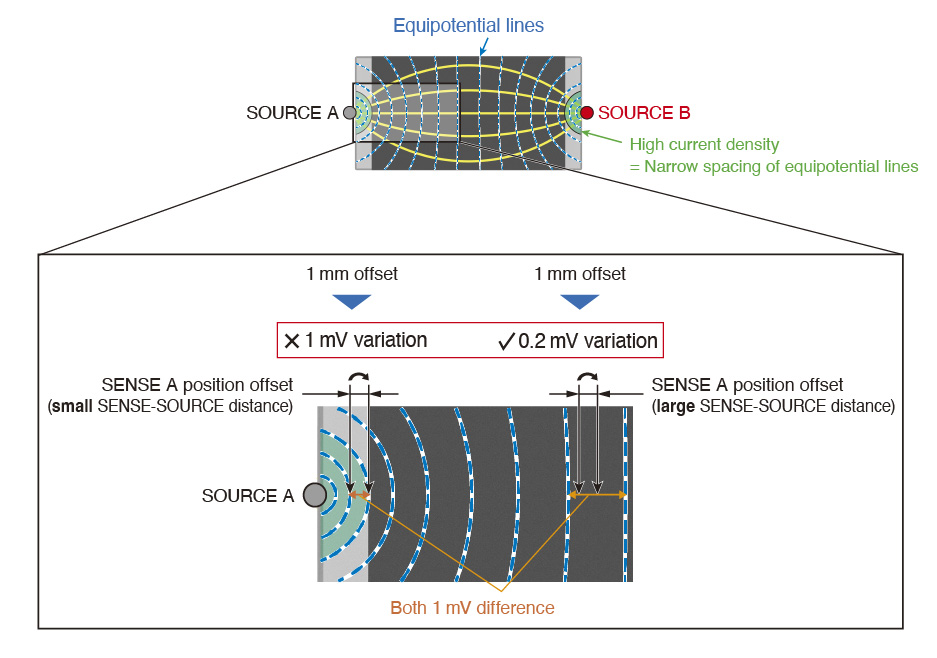
Fig. 5 Variation in equipotential lines by distance between SENSE and SOURCE
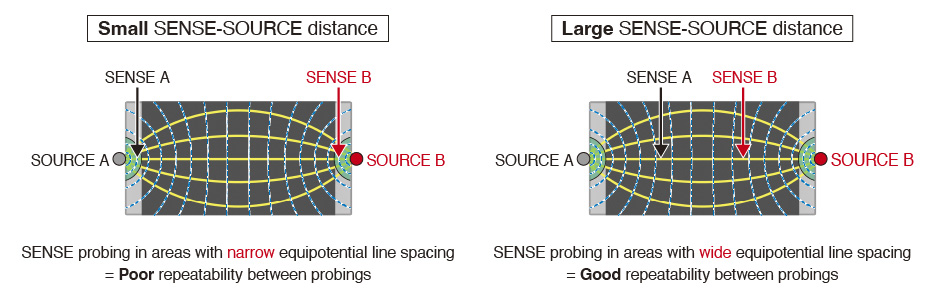
Fig. 6 Variation ㏌ measured values due to distances between SENSEs and SORCEs
Solution: Probing techniques for accurate measurement
In this section we describe 3 techniques to improve the measurement accuracy. These techniques include 1) optimizing the distance between SENSE and SOURCE, 2) emulating board mounting by using 6-terminal measurements and 3) using jigs to mount the probes. By implementing these techniques, you can dramatically improve measurement accuracy and reproducibility.
1. Optimize the distance between SENSE and SOURCE
It is generally recommended to maintain a SENSE-SOURCE distance that is at least three times the width and thickness of the DUT.
This allows for the measurement of uniform current, thereby minimizing discrepancies between specification/theoretical values and measured values, as well as variations in measured values between probing positions.
However, in many cases, it is difficult to measure with sufficient SENSE-SOURCE distance. In such cases, it is quite challenging to match the theoretical values or specifications with the measured values. The specification values of chip resistors or the theoretical resistance values of metal rods are based on the assumption that current flows uniformly through them. Since the actual current flow differs from ideal conditions, measured resistance values vary from expected values.
In such cases, Hioki recommends comparing the resistance values of good and defective products relatively.
2. Emulate board mounting with 6-terminal measurement
When you want to bring the measured values closer to the theoretical values, HIOKI recommends the 6-terminal measurement method shown in fig. 7. In the 6-terminal measurement method, two terminal pairs inject a known current into the device. This method approximates the current density in the board-mounted state better than when using only one terminal pair. The field generated in the DUT is more uniform than when using only one terminal pair. The third set of terminal probes this field.
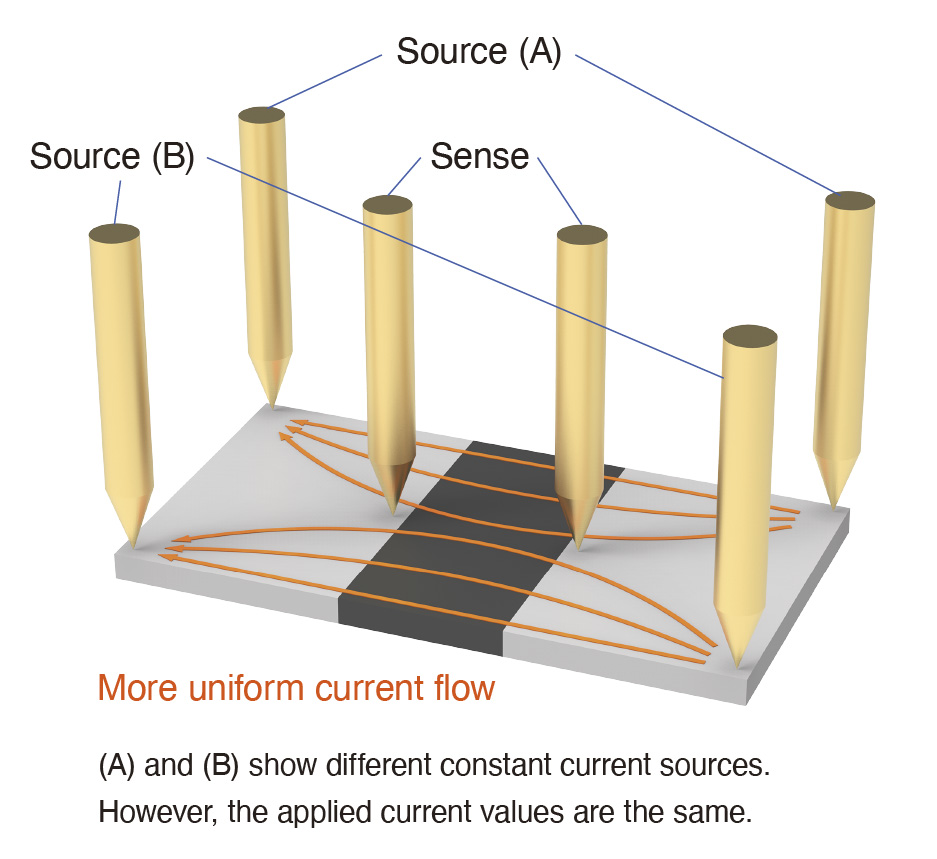 Fig. 7 6-terminal measurement
3. Utilize jigs for high reproducibility
Handheld probes are great to quickly verify the resistance of a DUT. However, small variations in probing pressure reduces the repeatability. Similarly, when testing the same device multiple times, it is impossible to use the same probe points and to apply exactly the same pressure every time. This leads to low reproducibility of the measurements. For that reason, when repeatability and reproducibility are important, it is crucial to use a jig that minimizes measurement variations.
Summary: Taking low resistance measurement to the next level
Low resistance measurement can be made much more accurate and reliable with clever probing techniques. Use the RM3545A or RM3546 and the probing know-how introduced in this article enhances your resistance measurements. If you have any questions about resistance measurements, please feel free to contact us via the inquiry form on the HIOKI official website or contact your nearest application engineer.
Related materials
- User's guide: Resistance Measurement Handbook
- Technical Note: Measuring Wide or Thick Resistors