Easy Quantitative Evaluation of Electrical Percolation in LiB Slurry and Electrode Sheets
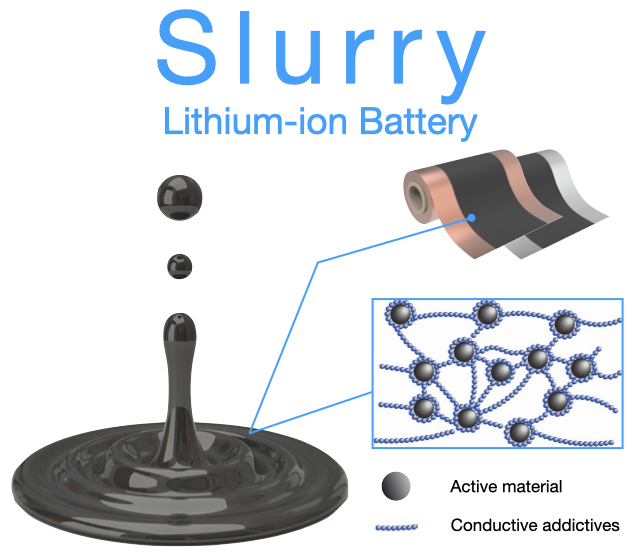
In R&D for various materials, it is essential to analyze the electrical percolation phenomenon of the composite materials. In lithium-ion batteries, researchers can better choose the optimal battery materials and ultimately reduce man-hours by evaluating the percolation phenomenon of the electrode sheet composite material. Hioki has discovered that the percolation phenomenon can be observed in 2 early stages of LiB battery R&D: slurry and electrode sheet. The percolation for the electrode sheet can be found in the resistance of the composite layer and interface, while it can be found in the slurry’s resistance. Hioki's Slurry Analysis System and Electrode Resistance Measurement System make analysis and identification of the percolation phenomenon quick and easy.

Choosing Optimal Battery Materials through Quantitative Evaluation of Slurry and Electrode Resistance
Previously, it was not possible to measure the electrode sheet’s interface resistance (between the current collector and composite) or the slurry’s resistance. As a result, material selection had to be done based on trial-and-error—repeating prototyping and performance observation. This took a lot of time and effort. By using Hioki’s RM2610 Electrode Resistance Measurement System and Slurry Analysis System, it is now possible to quantitatively analyze the resistance of both the slurry and the electrode sheet’s composite/collector interface. These allow the researcher to efficiently evaluate and choose the optimal battery materials.

Real Data: Slurry’s DCR & R-ratio and Electrode Sheet’s Composite Layer Resistance & Interface Resistance
At Hioki’s Battery Lab, Hioki’s engineers make their own electrode sheets and conduct experiments. In the particular experiment below, they created a cathode composed of cathode active material (NCM), acetylene black (AB), and polyvinylidene fluoride (PVDF). They varied the concentrations of AB and conducted various measurements on the samples.
The DC resistance (DCR) of the slurry confirmed the percolation phenomenon (see Fig. 1). In addition, the R-ratio (ratio of resistance deriving from the conductive material, AB) also increased. These data indicate the formation of a good conductive path. (For a detailed explanation of the indicators from the Slurry Analysis System, click here.)

Additionally, the best amount of conductive material can be inferred at 2% when looking at the electrode sheet’s composite layer resistance and interface resistance (See Fig. 2). In particular, when considering the interface resistance, it becomes clear that simply increasing the concentration of the conductive material does not lead to significant changes in resistance. From these observations, Hioki engineers concluded that the lower limit of added AB could be quantitatively estimated upstream in the R&D process, that is to say, during slurry development.
In conclusion, Hioki’s solutions in resistance measurement enable researchers to easily observe electric percolation in the upstream of R&D, making the selection of composite materials much easier and quicker. In this way, Hioki provides researchers, manufacturers, and maintenance technicians with solutions that make the realization of a sustainable society much more easy, efficient, and profitable. For more information about these solutions, please visit the webpage of the Slurry Analysis System or Electrode Resistance Measurement System, or contact us through our contact form to get in touch with the Hioki representative that is the best match for you.


