Measurement of DC Voltage Bias Characteristics in Multilayer Ceramic Capacitors (MLCCs)
The capacity of multilayer ceramic capacitors (MLCCs) is growing. Additionally, the components are frequently considered as an alternative to tantalum capacitors and electrolytic capacitors due to their small size. In such substitutions, the voltage dependence of capacitance merits caution as an MLCC characteristic.
Market trends
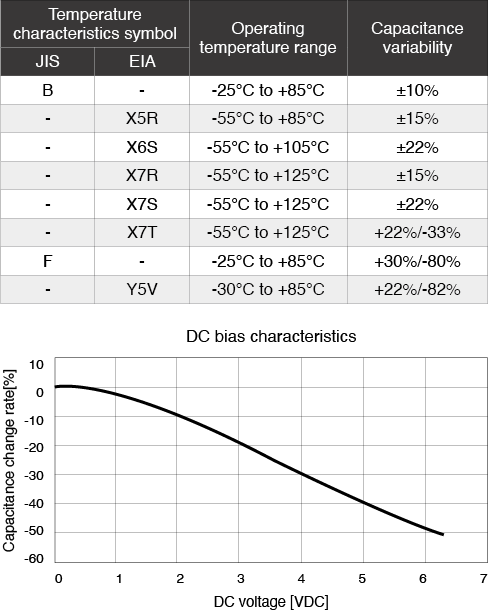
High-dielectric-constant materials like barium titanate are used as dielectrics in small, high-capacity MLCCs. The characteristics of such materials include temperature dependence, causing their capacitance to vary with temperature, and voltage dependence, causing their capacitance to vary with the magnitude of the applied voltage. When applying a DC voltage to an MLCC, for example when using an MLCC as a bypass capacitor, it’s necessary to check whether the MLCC has sufficient capacitance. Opportunities for evaluating DC bias characteristics when a DC voltage is applied to an MLCC are becoming increasingly common.
Issues
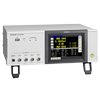
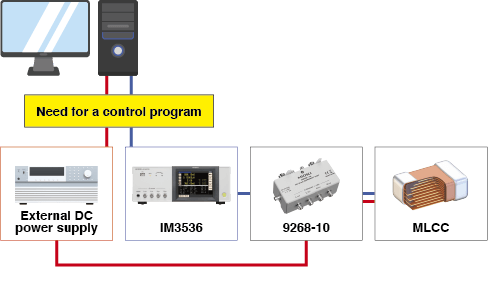
The high cost of LCR meters with functionality for applying a DC voltage to an MLCC means they may be provide an excessive level of sophistication in terms of specifications when frequency of use is considered. Additionally, in order to use an LCR meter and DC power source to evaluate the characteristics of an MLCC by applying a bias DC voltage to the component, it’s necessary to build a control program.
Solution
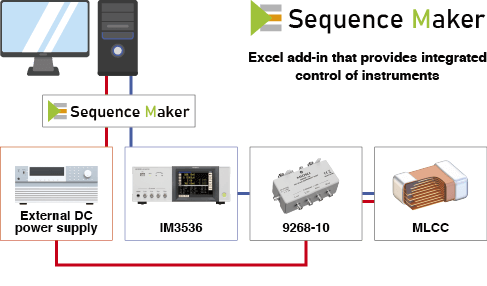
“Sequence Maker” is an Excel add-in that provides integrated control of measuring instruments. It supports USB, RS-232C, LAN, and GPIB as communications interfaces. It also supports VISA, a model-agnostic communications driver for instruments. Since it can automatically search for and connect to instruments that are connected to a PC, you can implement the desired control by noting the control commands you wish to execute in order in the Excel file.
Measurement data
Since “Sequence Maker” is an Excel add-in that provides integrated control of instruments, you can render graphs and manipulate captured data using Excel functions. There’s no need to worry about how to process the data that you captured with a program you developed yourself. You can compare data and create reports using familiar Excel functionality.