Slurry Analytical System (Cloud-based Analysis Software)
For estimating and approaching the ideal slurry internal state
-
 2022
2022
HIOKI offers advanced quality test solutions for electrode Slurry.
-Three parameters indicate the mixture condition of the slurry based on impedance
-Hardware & Software ideal for slurry impedance measurement
-Data & Analysis tool for various types of slurry
Unique HIOKI Slurry Analysis technology provides quantified mixing quality of electrode slurry to approach your ideal Battery. It enables you to optimize the slurry process and helps detect quality deviations in future battery cell manufacturing upstream processes. Ultimately, this will lead to the stabilization of cell quality.
Slurry Analytical System Capabilities
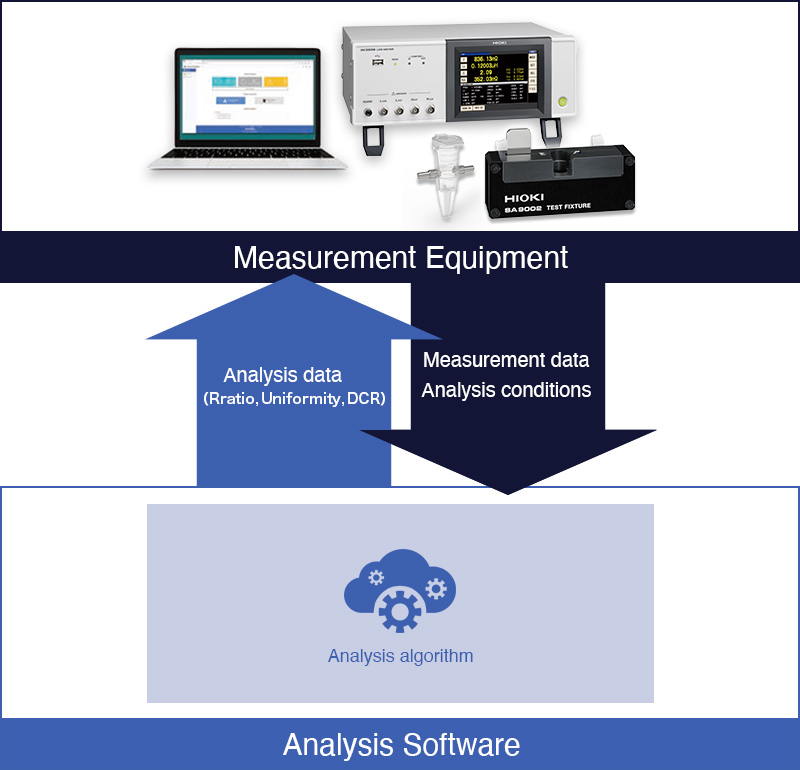
Hioki's Slurry Analytical System measures slurry impedance and analyzes the information. The measurement data lets you assess the slurry’s impedance, while the analysis can aid in improving the slurry's mixture conditions.
Key Features
- A proprietary Hioki algorithm analyzes impedance measured values for LiB electrode slurries
- Easily measure impedance of slurry
- Analysis Results “DCR, Rratio, Uniformity” indicate electron conductivity of Slurry
- Cloud-based analysis software ensures you always have access to the latest version
- Able to choose license plan, fit the right solution for your needs
Model No. (Order Code)
| IM3536 | LCR Meter, measurement frequency: DC, or 4 Hz to 8 MHz |
|---|---|
| SA2631-03 | 30-days License (No limit on the number of analyses that can be performed) |
| SA2631-05 | 365-days License (No limit on the number of analyses that can be performed.) |
| SA9001 | Electrode cells, sold in lots of 50, for NMP solvents |
| SA9001-01 | Electrode cells, sold in lots of 50, for aqueous solvents |
| SA9002 | SA9001(-01) dedicated test fixture |
Basic Instructions
Prepare a measurement environment and measure the slurry’s impedance. Analytical software in the cloud will perform analysis using the optimal algorithm.
1. Preparing a measurement equipment
Provide a measuring instrument for use in measuring the slurry’s impedance. The following instruments are recommended:
- LCR Meter IM3536 (Measurement Software SA2633 is available free of charge.)
- Test Fixture SA9002
- Electrode Cell SA9001, SA9001-01
2. Make measurements using the recommended equipment
Fill an electrode cell (slurry container-jig) with about 1 mL of slurry.
Insert the cell into the test fixture (press until it clicks).
Measure the impedance for about 1 minute using the LCR meter and analysis software.
3. Log in to the analysis software
Create a free account. Enable the analysis function by registering your registration code. The registration code can be found on the license card you purchased.
Log in to the analytical software
4. Send your data and receive analytical values
Select the measurement data and analysis conditions.
See the specifications below for more information about analysis conditions.
Click here to view specifications for the Slurry Analytical System.
Analysis principles
The Slurry Analytical System outputs three quantitative indicators (DCR, Rratio, and uniformity) that can be used to make a relative evaluation of slurry conductivity. It builds an electrical equivalent circuit (EEC) that corresponds to the manner in which current flows and electrons move when an AC current flows to the slurry. Please see this FAQ for details.
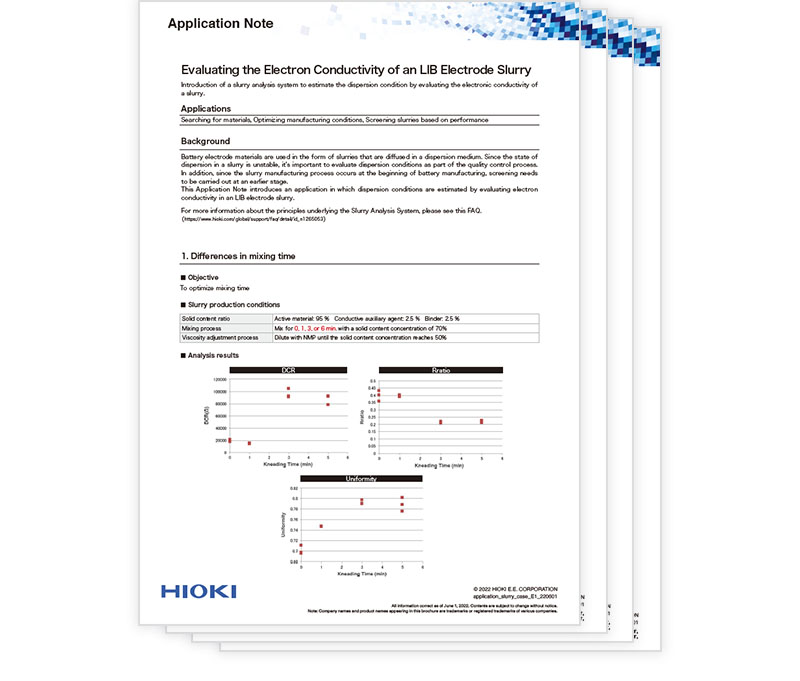
Analysis and observation examples
See how analysis is actually carried out.
- Example 1: Analyzing differences due to kneading time
- Example 2: Analyzing differences in conductive auxiliary agent quantity
- Example 3: Analyzing the relationship between electron conductivity and dynamic viscoelasticity resulting from differences in dispersant quantity
Analytical Software SA2632
| System requirements (computer) | Memory: 512 MB or more Hard disk: 1 GB or more of available space Display: 1024 × 768 dots or more, 65,536 colors or more Web browser verified for operation: Microsoft Edge and Google Chrome, both of which run on Windows 11, Windows 10 Pro, or Windows 8.1 Pro Google Chrome, which runs on macOS |
|---|---|
| Login function | The login screen is displayed when "https://slurry.circuitfitting.net/" is accessed The analysis related screen (my page) is displayed when you log in using the GENNECT account |
| License authentication | 3-day license, 30-day license, 365-day license The analysis function is only available when the license is activated |
| Analysis item | - DCR - Rratio - Uniformity |
| Impedance data file upload | - Maximum number of files to be uploaded simultaneously: 30 - Total size limit of files to be uploaded: 1 MB - File extension: CSV Files uploaded simultaneously have the same material information and analysis conditions. |
| Supported file formats | CSV file obtained by the measurement software (SA2633) |
| Analysis time (representative value) | - Approx.1 minute/file - Number of files to be simultaneously analyzed: 50 |
| Language | Japanese, English (default setting: English) |
Measurement Software SA2633
| System requirements (computer) | Memory: 512 MB or more Hard disk: 1 GB or more of available space Display: 1,024 × 768 dots or more, 65,536 colors or more Interface: USB 2.0 or more to be installed OS: Windows 8.1 (32-bit/64-bit) Windows 10 (32-bit/64-bit) Windows 11 (64-bit) .NET Framework: 4.7.2 |
|---|---|
| Instrument to be controlled | IM3536 LCR Meter |
| Measurement data save function | Outputs the measured impedance data in the file format that can be loaded using the SA2632 Analytical Software. File extension: CSV |
| Measurement time | Approx. 1 minute |
Electrode Cell SA9001, SA9001-01
| Dimensions | Approx. 27W × 42H × 37D mm (1.06″W × 1.65″H × 1.46″D) (including the electrode) |
|---|---|
| Weight | Approx. 2.3 g (0.1 oz.) |
| Material | Container: polypropylene (PP), electrode: brass (nickel plated) |
| Capacity | Approx. 1 mL |
| Electrode pin | Diameter (Area where liquid to be measured comes in contact): 3 mm ±0.1 mm Electrode interval: 6 mm ±0.3 mm |
| Operating temperature and humidity range | 23°C ±5°C (73°F ±9°F), 80% RH or less (non-condensing) |
| Storage temperature and humidity range | −10°C to 50°C (14°F to 122°F), 80% RH or less (non-condensing) |
| Operating environment | Indoors, altitude up to 2000 m (6562 ft.) |
| Product warranty duration | The Electrode Cell is a consumable and is not covered by the warranty |
Test Fixture SA9002
| Measurable frequency | DC to 10 MHz |
|---|---|
| Connectable sample | SA9001 Electrode Cell |
| Residual impedance | Residual resistance during short circuit 200 mΩ or less (reference for 100 Hz) Inter-electrode stray capacitance 0.2 pF or less (reference for 1 MHz) |
| Dimensions | Approx. 98W × 38H × 24D mm (3.86″W × 1.50″H × 0.94″D) (excluding protruding parts) |
| Weight | Approx. 210 g (7.4 oz.) |
| Included accessory | Shorting plate for compensation |
Measurement conditions*
| Frequency sweep range | Minimum frequency: 0.9 mHz to 110 kHz Maximum frequency: 190 kHz to 310 MHz |
|---|---|
| Number of measurement points | Between 490 points and 1100 points in logarithmic intervals |
| Applied signal | Constant-voltage, ±100 mV |
| Measurement parameters | Frequency, Rs (ReZ), X (ImZ) |
The number of data required depends on the measurement frequency range.
(Reference value)
1 mHz to 200 kHz: 700 points
1 mHz to 8 MHz: 1000 points
4 Hz to 8 MHz: 500 points
4 Hz to 300 MHz: 1000 points
100 kHz to 300 MHz: 500 points
Available material categories
| Active materials | NMC, LCO, NCA, LFP, LMO, MnO2/CFx, Graphite, LTO, Si, SiO, Activated Carbon, None |
|---|---|
| Conductive aid | Acetylene Black, Furnace Black, Carbon Nanotube, Graphite |
| Binder | PVDF, SBR, PTFE, None |
| Dispersant | CMC, MC, PVP, None |
| Solvent | NMP, Water |
License card, Electrode cells, Test fixture (5)
*Please purchase electrode cells and licenses as necessary based on your expected frequency of use and experimental plan.
*Sensitive information will be shared with customers, including during use of analysis functionality. Customers are responsible for determining whether to make purchases through a retailer.
Period of use: 30 days (continuous)
*There is no limit on the number of analyses that can be performed.
Period of use: 365 days (continuous)
*There is no limit on the number of analyses that can be performed.
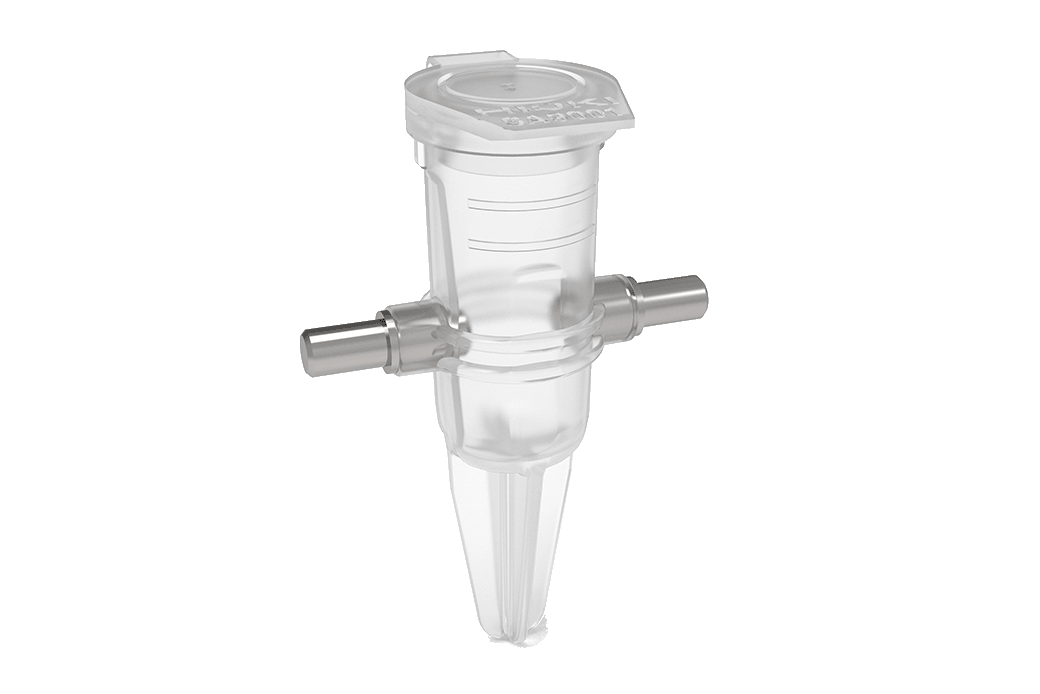
Sold in lots of 50
For injecting the slurry being measured, for NMP solvents
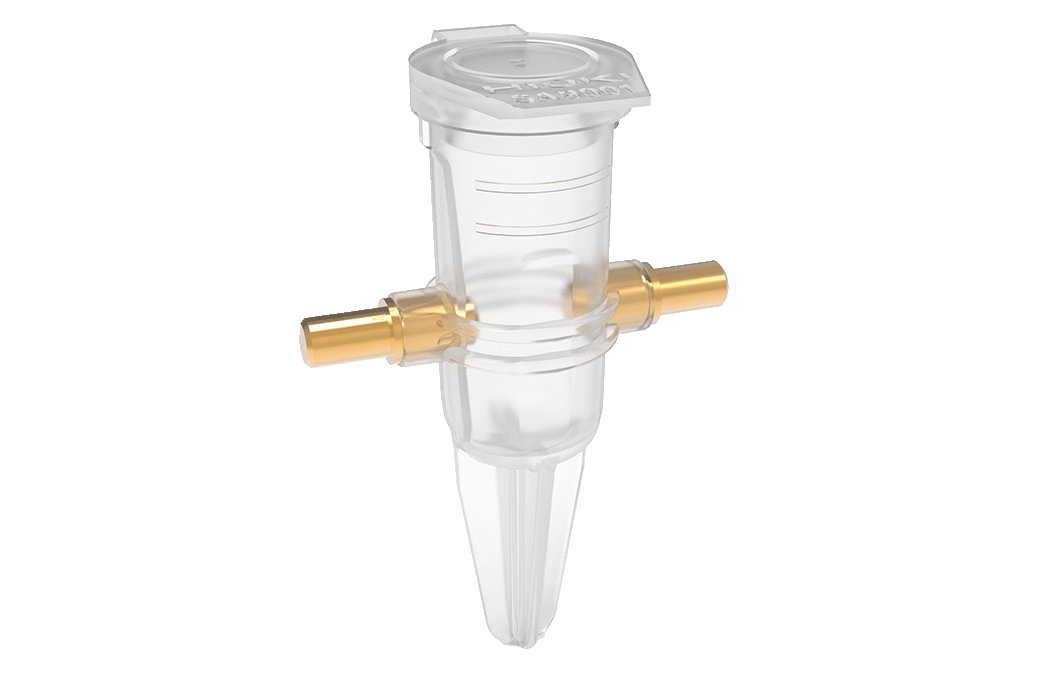
Sold in lots of 50
For injecting the slurry being measured, for aqueous solvents
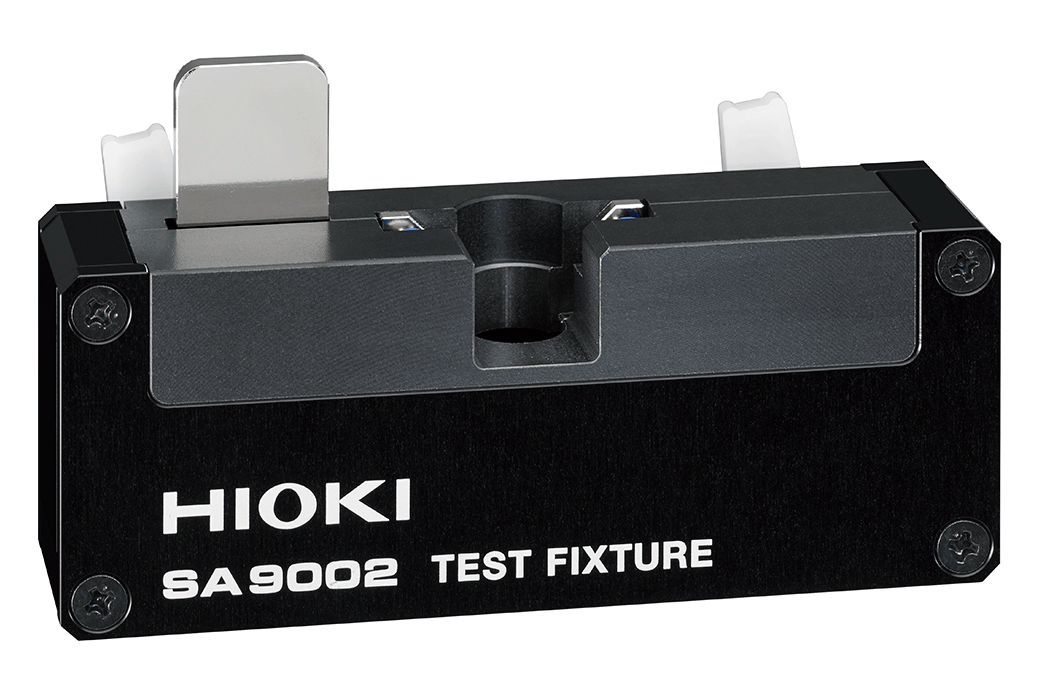
SA9001 dedicated test fixture
One-touch connectivity for the SA9001
-
TEST FIXTURE SA9002
 Instruction Manual
Japanese
Instruction Manual
Japanese
English Ver.01 -
SLURRY ANALYTICAL SYSTEM
Instruction Manual
Simplified Chinese
Ver.01
-
SLURRY ANALYTICAL SYSTEM
Instruction Manual
Korean
Ver.02
-
SLURRY ANALYTICAL SYSTEM
Instruction Manual
English
Ver.02
-
ELECTRODE CELL SA9001
Instruction Manual
Japanese
English Ver.01 -
3-DAY LICENSE SA2631-01, 30-DAY LICENSE SA2631-03, 365-DAY LICENSE SA2631-05
Instruction Manual
Japanese
English Ver.00
-
TEST FIXTURE SA9002
Ver.00
-
ELECTRODE CELL SA9001
Ver.01