Simplify RDE Testing with Seamless Energy Consumption Analysis
Laboratory-based standards such as WLTP (Worldwide Harmonized Light Vehicles Test Procedure) are essential, but they can’t capture the full complexity of how vehicles behave in real-world environments. Urban traffic jams, long highway drives, steep mountain roads—only Real Driving Emission (RDE) testing (or Real-World Range testing for EVs) can reveal the true energy performance and environmental impact of a vehicle. As regulatory frameworks in Europe and other countries increasingly mandate real-road validation for gas-powered vehicles, RDE testing is becoming critical not only for compliance but also for engineering development. Although Real-World Range testing is not mandatory for EVs, there is a growing trend toward placing greater emphasis on actual energy consumption for EVs as well.
Challenges: Why Real-World Range Testing Is Not Simple
Real-world testing presents significant obstacles:
- High-precision measurement tools are bulky, but they must fit inside the vehicle during the test
- Test equipment must withstand vibration and temperature shifts
- Diverse data sets—power, current, temperature, and CAN signals—must all be consolidated in one place to find correlations
Case Scenario: an EV Development Team’s Real-Drive Journey
Let’s explore a hypothetical example that illustrates the full potential of Hioki’s solution. A pilot EV departs from a development site for a 80 km test run, across city areas, suburban roads, and highways.
The engineering team faces three main goals:
- 1.Ensure both accuracy and safety for measuring battery power consumption
- 2.Understand differences between actual energy efficiency and catalog specifications in city areas, suburban areas, and highways
- 3.Track current consumption from air conditioning system
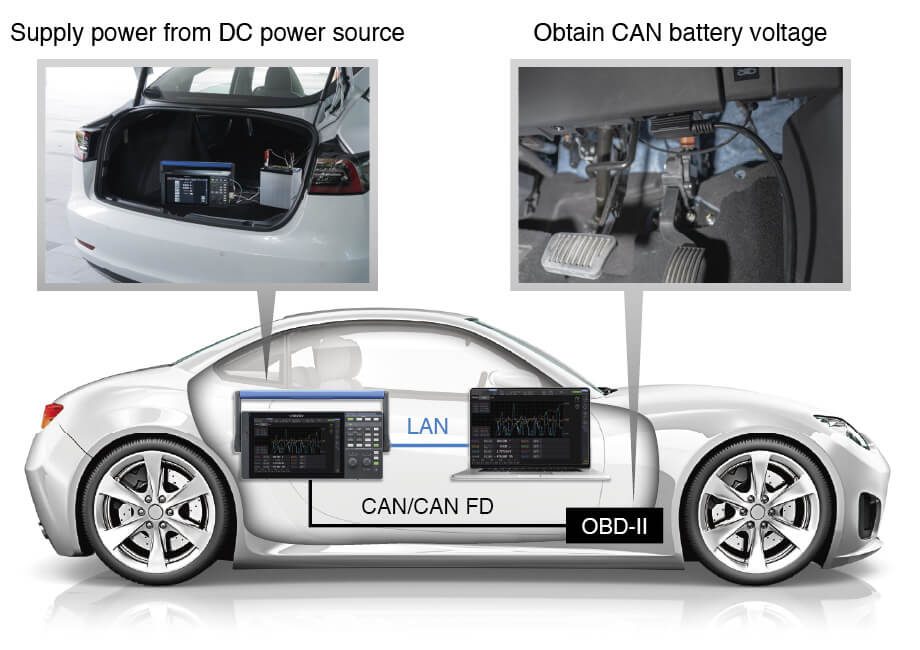
Fig. 2. RD test for EVs
Test Setup: Behind-the-Scenes of Real-World Measurement
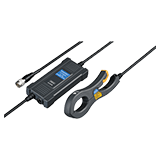
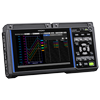
For power consumption analysis, the PW4001 Power Analyzer is installed using clamp sensors that can be safely attached even in narrow spaces underneath the vehicle.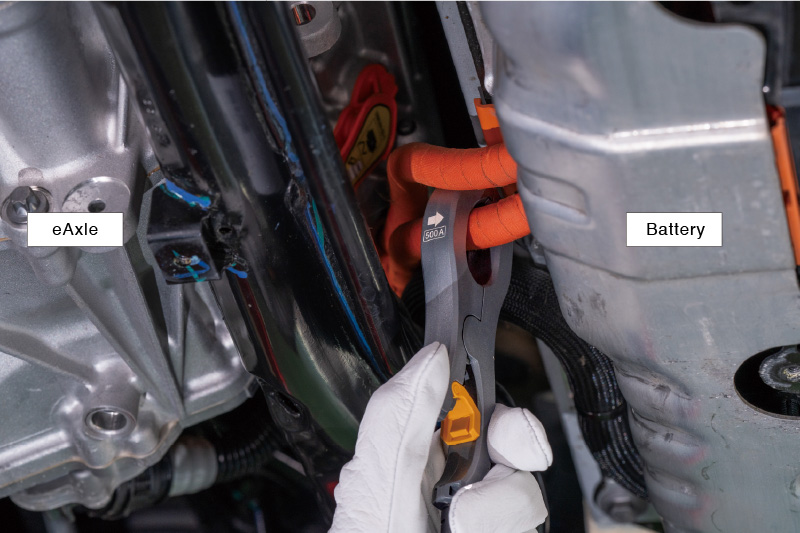
Fig. 3. Engineer attaching the CT6834 current sensor between the battery and the eAxle under the car
The PW4001 calculates real-time power by combining voltage data via CAN readings with current data from clamp sensors—no risky direct connection to high-voltage terminals.
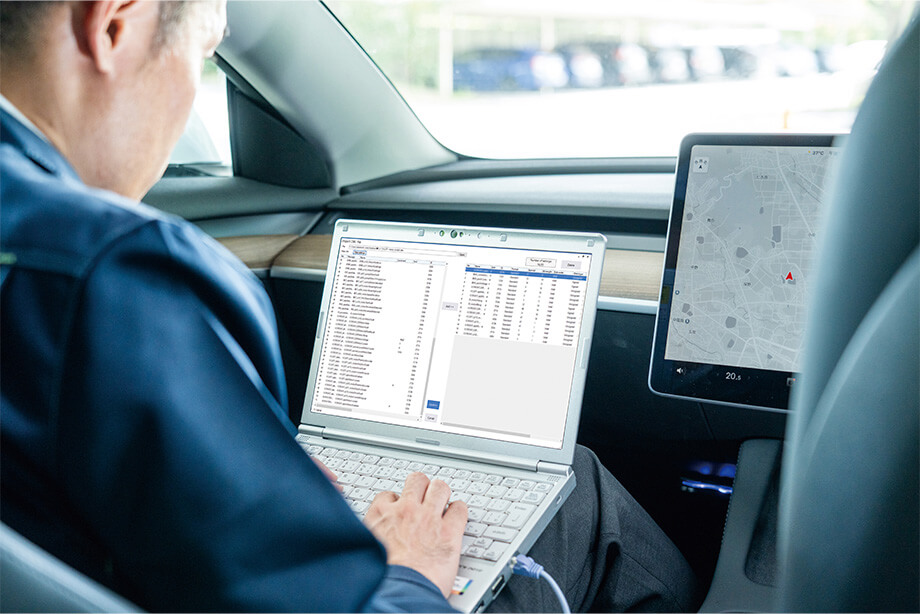
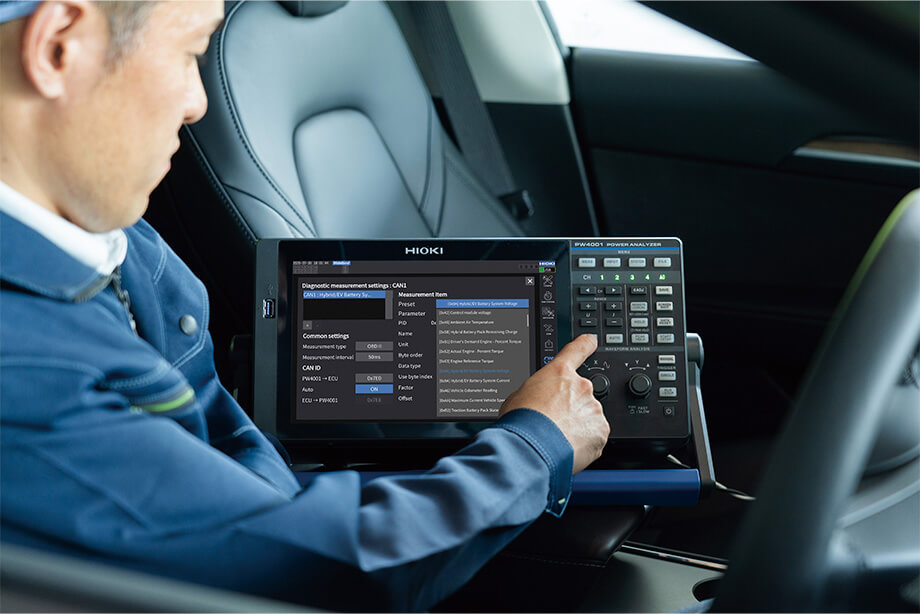
Fig. 4. Engineer sending CAN IDs of the DBC file to the PW4001 inside the car
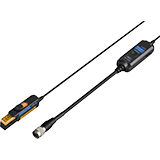
To measure heat pump's current (air conditioner's current), compact CT6831 AC/DC sensors capture even minute fluctuations in power consumption.
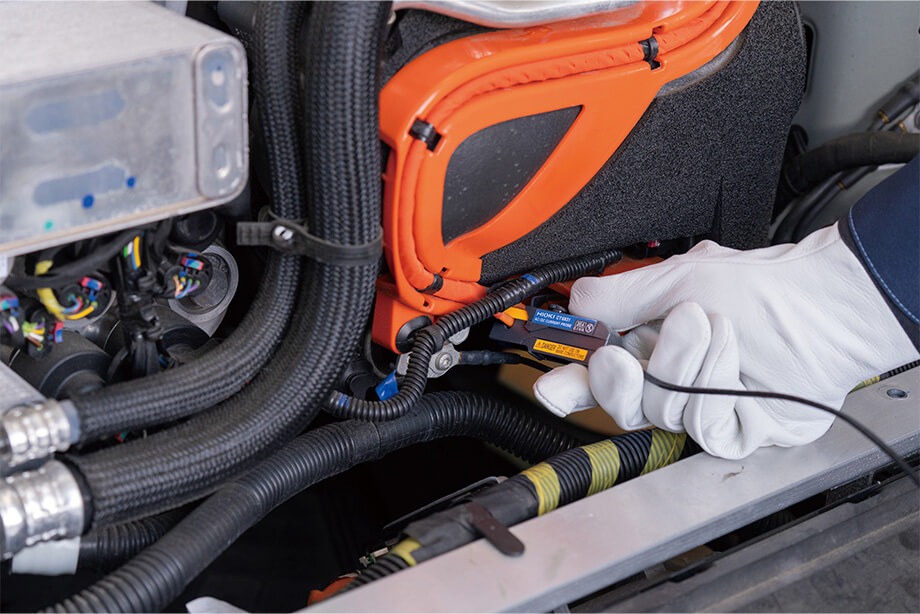
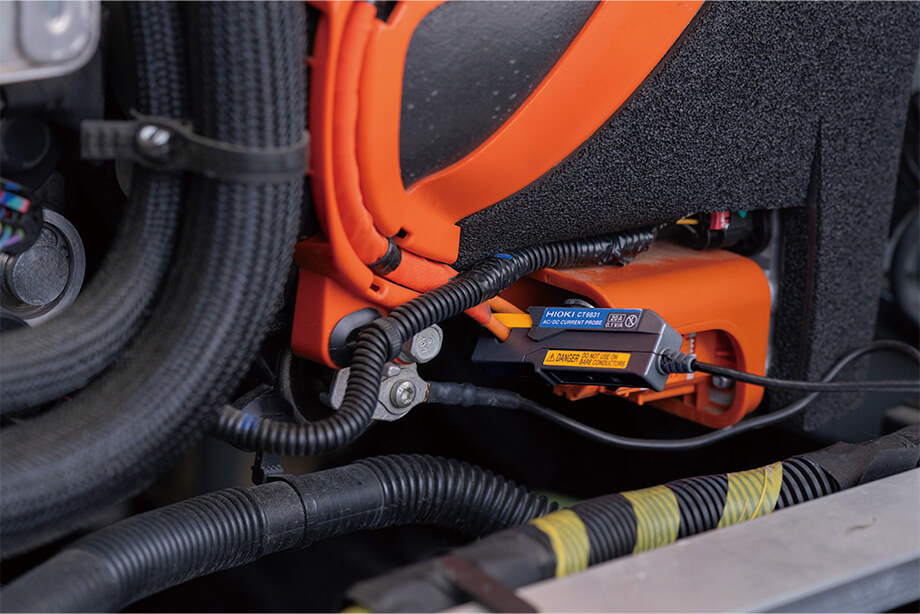
Fig. 5. Ultra-compact AC/DC current sensor CT6831 attached in the vehicle’s dense wiring
Dynamic Data During the Drive
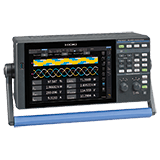
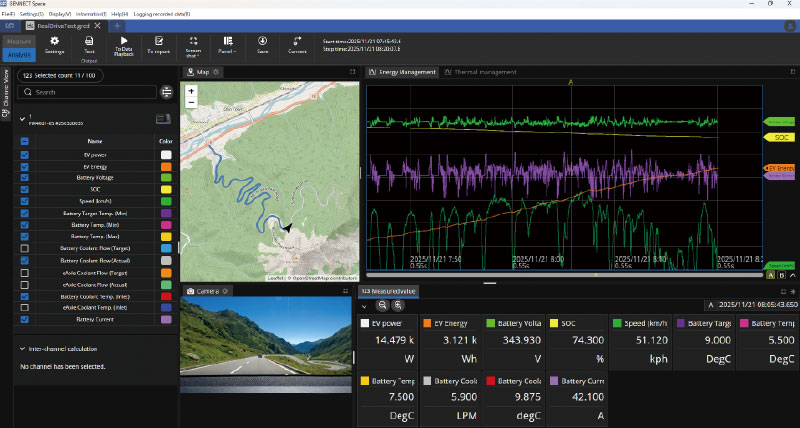
Throughout the test, engineers monitor all measurements in real time using the Gennect Space software (Fig. 6).
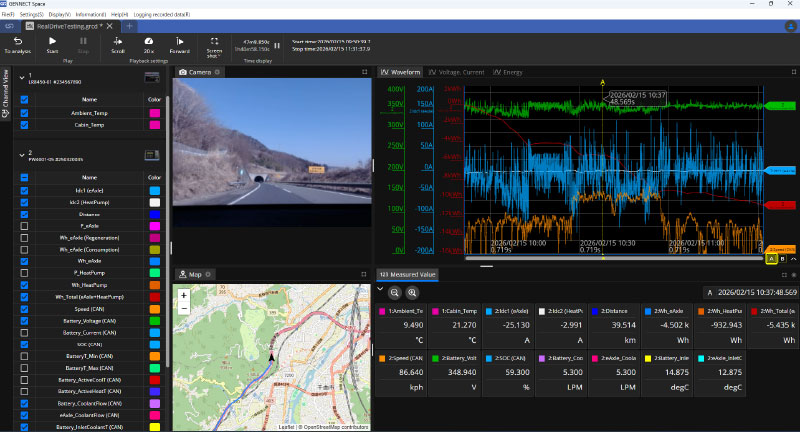
Fig. 6. Energy consumption test result (all measurements)
During the first 10 minutes of driving, the current consumption of the air conditioning system is relatively high to heat the interior of the car. (Fig. 7).
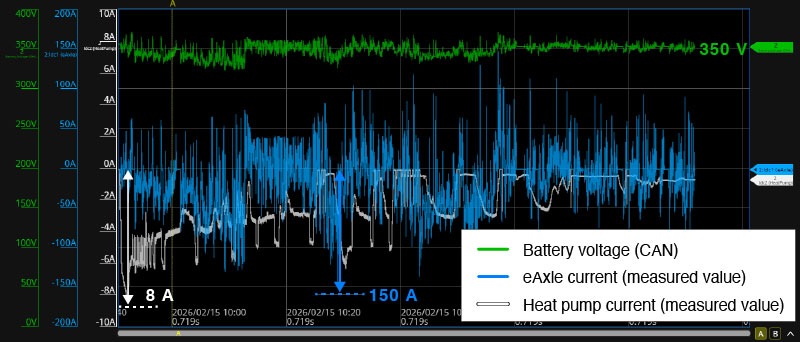
Fig. 7. Energy consumption test result (voltage and current)
Regarding energy consumption, a significant amount of energy was used on mountain roads and highways. However, the actual energy consumption on the highway turned out to be better than the catalog specifications. This is believed to be due to the fact that the course this time was predominantly downhill. Similarly, for city areas, as most of the course was downhill, energy consumption was low (Fig.8, Table 1).
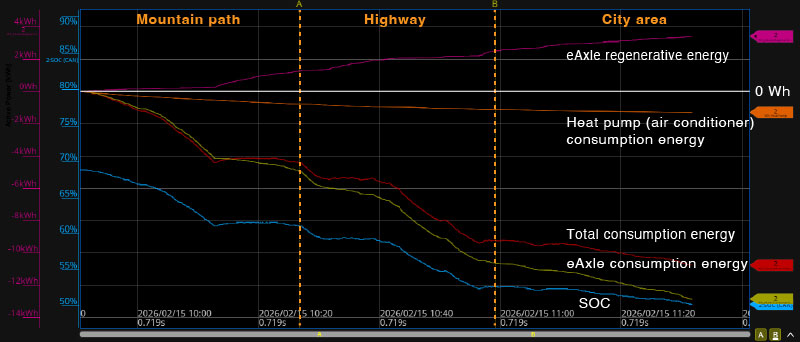
Fig. 8. Energy consumption test result (energy)
Table1: Energy consumption test result (energy efficiency)
| Area | Consumption energy (distance) | Energy efficiency |
|---|---|---|
| Mountain path | -4.405 kWh (24 km) | 184 Wh/km |
| Highway | -4.829 kWh (44 km) | 110 Wh/km |
| Urban area | -1.531 kWh (15 km) | 102 Wh/km |
The eAxle consumes 13 kW of energy, but approximately 26% of that, which is 3.4 kW, was recovered (Table 2).
Table2: Energy consumption result (consumption energy and regenerative energy)
| Parameter | Result |
|---|---|
| Wh_eAxle (consumption) | -12.859 kWh |
| Wh_eAxle (regenerative) | 3.380 kWh |
| Wh_HeatPump (consumption) | -1.286 kWh |
| Wh_Total (consumption) | -10.765 kWh |
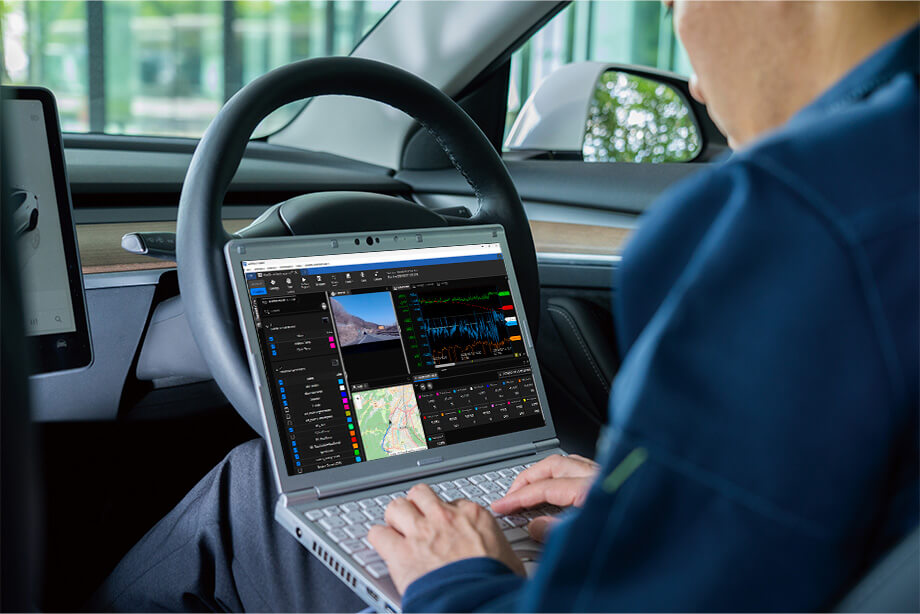
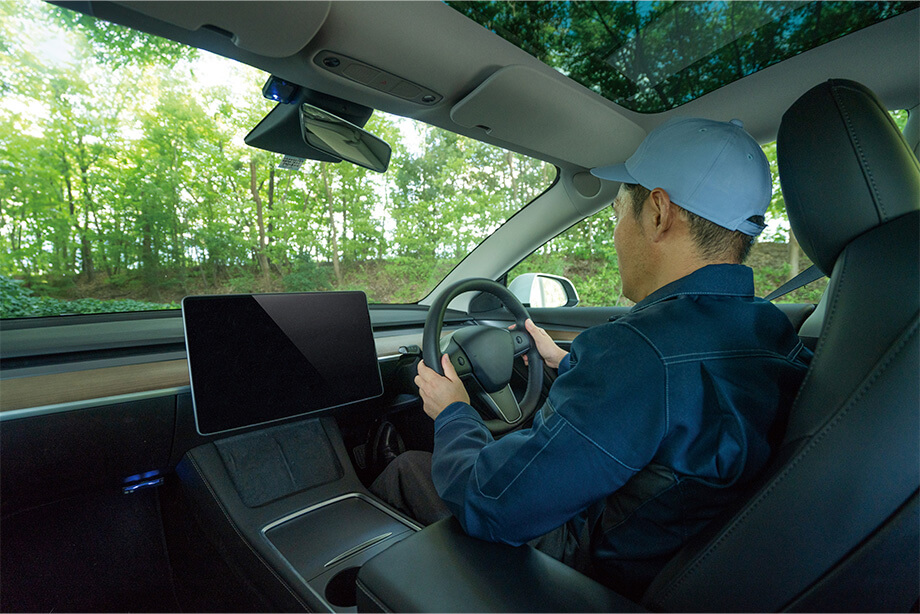
Fig. 9. Engineer reviewing test data on in-vehicle laptop screen
Visualizing driving tests in real time and through replay
Gennect Space is HIOKI’s data integration software that unifies measurement data on a PC for analysis and visualization. During driving tests, measurement data is recorded to a PC in real time, enabling comprehensive visibility into vehicle behavior.
Key Features
- Real-time recording of voltage, current, power, and energy data with a 1 ms update rate
- Synchronization with GPS-based map data to correlate measurement values with driving routes
- Time-synchronized video recording from onboard cameras to visualize driving scenes alongside energy behavior
During the test, engineers can intuitively monitor state changes and early signs of abnormalities in real time. After the test, recorded data can be replayed alongside driving routes and video footage, enabling an accurate review of energy consumption and regenerative behavior under real-world driving conditions.
This transforms driving tests from simple data logging into evaluations that can be understood in the moment and clearly explained afterward.
Why Hioki’s Integrated Solution?
Hioki brings unmatched value to real drive test environments through:
- PW4001:
High-accuracy power measurement, and safe non-direct connections - CT6834:
Precision clamp-type current sensor, making for reliable data - CT6831:
Minute current fluctuations are reliably captured - Gennect Space:
Unified software platform that accelerates data analysis
Conclusion
Real drive testing isn’t just about regulatory compliance—it’s a vital gateway to unlocking the true performance potential of next-generation vehicles.
Compact, rugged, and precise—Hioki’s measurement tools are purpose-built for the challenges of in-vehicle measurement.