How to Use Memory HiCorders・Setting Examples
Example applications in different industrial fields
1. Electrical and power-related
• Power supply analysis (momentary power outages, momentary voltage dips, power supply noise, harmonic analysis)
• Analysis of problems with electrical control systems
• Analysis of the characteristics of breakers and magnetic circuit interrupters
• Detection of short-circuits and ground fault circuits
• Generator and load dump testing
• Battery charge/discharge testing
• Servomotor and feedback system analysis
• Analysis of magnetic card playback signals
• Analysis of inverter input and output
2. Automotive, rail, and transport
• Automobile and engine control testing
Engine combustion analysis, ECU signal analysis, ABS testing, suspension testing, navigation system testing, airbag testing, 4WD testing, transmission testing, vibration testing while the vehicle is driven, sensor signal analysis, etc.
• Train car control testing
Element control testing, inverter motor control testing, train operation control testing, etc.; brake characteristics and vibration analysis, etc.
3. Manufacturing and machinery
• Control analysis in steelmaking, chemical, and other types of industrial plants
Analysis of instrumentation signals, analysis of solenoid valve and control system malfunctions
• Plant equipment maintenance, motor and bearing vibration analysis
• Hydraulic equipment pressure testing
• Analysis of characteristic vibration frequencies of various types of equipment and machinery
• Analysis of control systems for injection molding machines
• Diagnosis of malfunctions affecting rotating equipment
• Measurement of welding currents
• Analysis of malfunctions affecting automated equipment
4. Maintenance
• Elevator acceleration testing and analysis of electrical control malfunctions
• Analysis of rotating equipment
5. Other
• Material testing (compression, tension, load, vibration, and impact testing, etc.)
• Medical (recording of electrical activity of the heart, measurement in combination with various types of medical equipment)
• Construction and civil engineering (vibration and impact testing; analysis of characteristic vibration frequencies of various objects)
Chemical (explosive testing of gunpowder and pressure analysis)
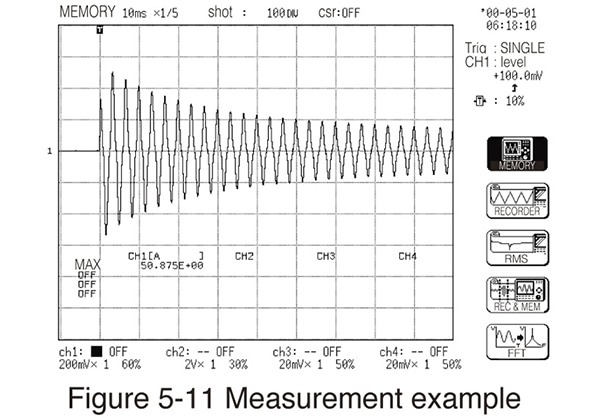
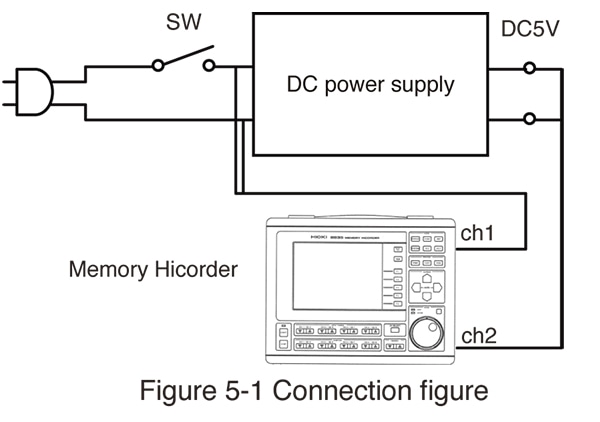
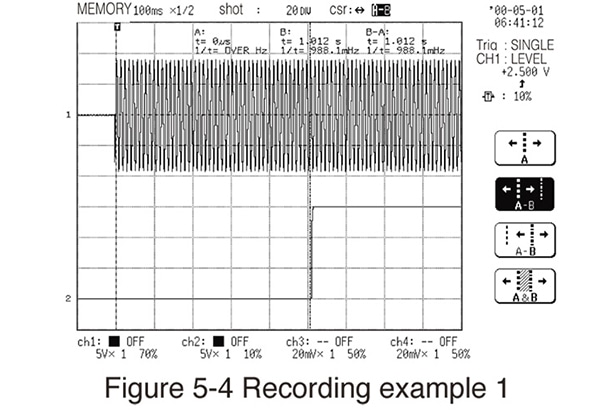
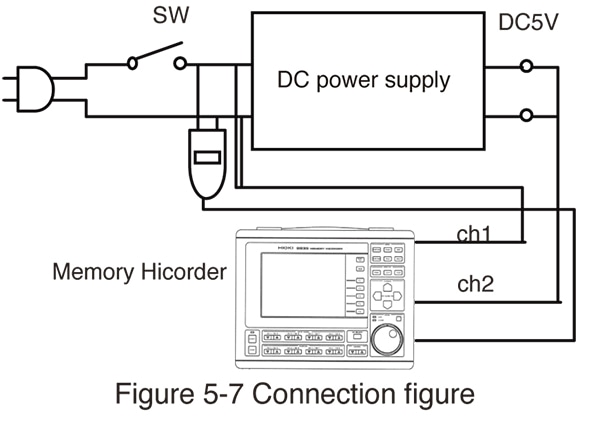
Example: Measuring the input and output characteristics of DC power supply
Objective:
To measure the rising time in output after the power supply switch is activated
Key considerations:
A level trigger should be activated at the rising edge of the primary input when the power switch is turned on.
1) Setting recording length
Since we want to capture data for about 2 s, set the shot length (recording length) to 20 div. at 100 ms/div.
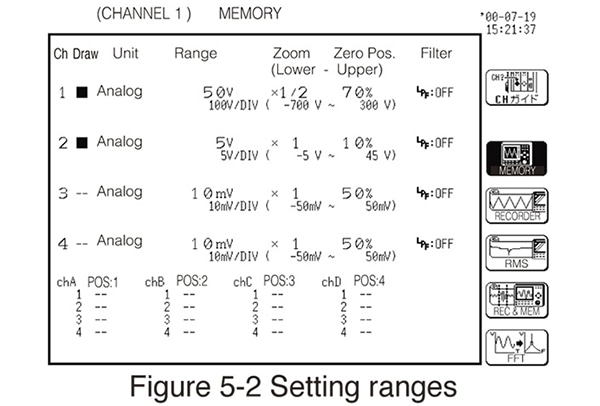
2) Setting input range
Since the primary side of the circuit is 100 V AC, which yields a P-P value of 282 V, set channel 1 to 100 V/div. Since the secondary side is 5 V DC, set channel 2 to 1 V/div.
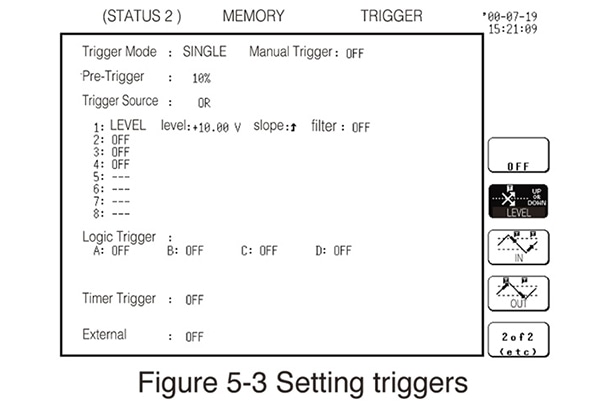
3) Making trigger setting
Since the voltage will change from 0 to 100 V (RMS) when the switch is turned on, set the trigger level to a rising slope that is greater than 0 V. This explanation will use a setting of 10 V.
4) Setting the trigger start point (Pre-trigger)
Since we want data after the switch is turned on, use a pre-trigger setting of 10%.
5) Selecting trigger mode
Since we need only one measurement, use single mode.
6) Data printing setting
If you wish the instrument to print data automatically when the trigger activates, turn on automatic printing on the status (settings) screen. If you wish to automatically save data in external memory, select the type of media and select the data format (binary or text). If you capture data on the screen even though automatic printing is off, you can record or print it later using the PRINT key, so turn this setting off.
7) Setting [Waiting for pre-trigger]
Check the input cord connections and press the START key. If the display indicates that the instrument is in the trigger standby state, it has been set up properly.
8) Recording
Turn on the power supply switch. If the instrument has been configured correctly, measurement will end once acquisition of the waveform data is complete.
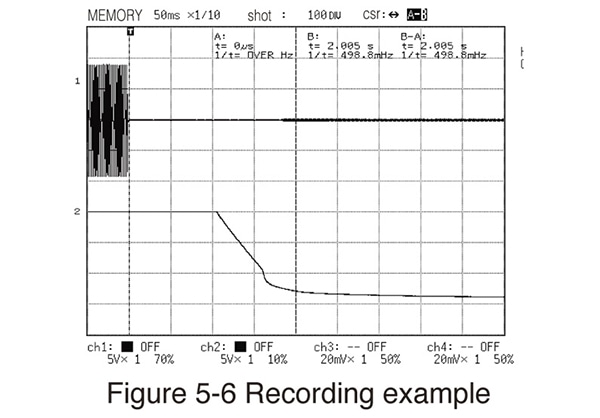
Example: Measuring the input and output characteristics of DC power supply 2
Objective:
To measure the fall time in output after the power supply switch is activated
Key considerations:
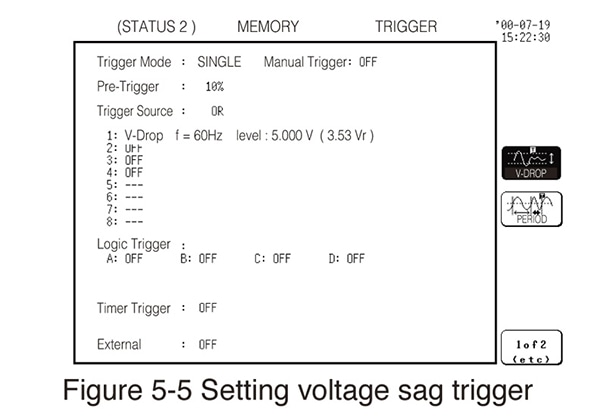
Configure a trigger so that it is activated by the falling edge of the AC power supply. Since the level trigger would not be activated for channel 1, use either a voltage drop trigger with peak value detection or set up a trigger to activate at the falling edge of the DC output voltage level. If you have a line-use logic probe, you can also set up a trigger to activate when the input logic level switches from 1 to 0. This explanation will focus on the measurement procedure when using a voltage drop trigger. Once you understand how to use this voltage drop trigger, you will be able to measure momentary outages and momentary voltage drops affecting AC power supplies.
■ Measurement using a voltage drop trigger
1) Setting recording length
Select the voltage drop trigger for channel 1 and set it to 5 V.
2) Setting input range
Since the primary side of the circuit is 100 V AC, which yields a P-P value of 282 V, set channel 1 to 100 V/div. Since the secondary side is 5 V DC, set channel 2 to 1 V/div.
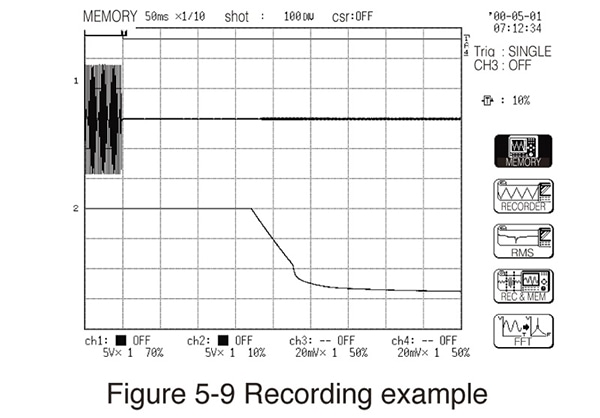
3) Setting display positions
Set the 0 positions to around 60% and 10% so that channels 1 and 2 do not overlap. (The positions can be changed later after data has been acquired if the channel displays overlap, so it’s fine if they do.)
4) Making trigger setting
Select the voltage drop trigger for channel 1 and set it to 5 V.
5) Setting the trigger start point (Pre-trigger)
Since we want data after the switch is turned on, use a pre-trigger setting of 10%.
6) Selecting trigger mode
Since we need only one measurement, use single mode.
7) Data printing setting
(Same setting as example of "Measuring the input and output characteristics of DC power supply")
8) Setting [Waiting for pre-trigger]
Check the input cord connections and press the START key. If the display indicates that the instrument is in the trigger standby state, it has been set up properly.
9) Recording
Turn off the power supply switch. If the instrument has been configured correctly, measurement will end once acquisition of the waveform data is complete.
*Same as Figure 5-1
■ Measurement using a line-use logic probe
Change the trigger condition settings and the logic channel display settings. Other settings are the same as described above.
1) Making trigger setting
Since the trigger will be activated based on logic input, set up a logic trigger. Using channel A1 [0.x.x.x] 4, set up the trigger so that it activates when channel A1 changes from 1 to 0.
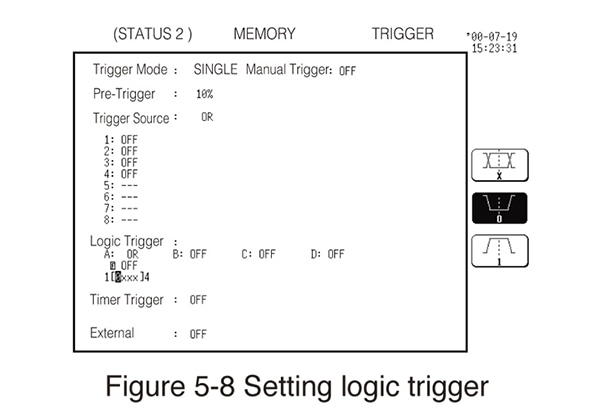
2) Displaying logic channel
Display the logic channel A1 on the channel display screen.
3) The remaining settings are the same as those that were described in the previous section.
If you encounter a self-hold circuit such as a sequence control circuit that exhibits the issue of resetting when this approach is applied, you can analyze the issue, for example in the power supply circuit, by setting up a trigger to activate depending on whether or not the self-hold circuit has a voltage.
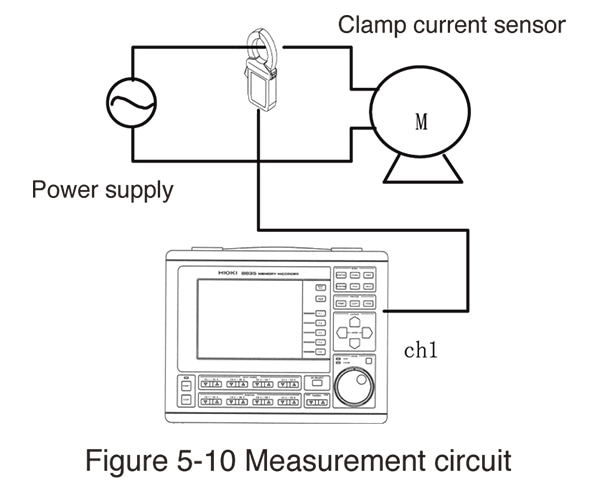
Example: Measuring starting current waveforms of motors
Objective:
Although instruments such as normal ammeters cannot be used to measure quantities such as instantaneous load current fluctuations or starting current, a Memory HiCorder can easily do so using waveform levels when utilized in combination with a clamp current sensor.
Key considerations:
Use a clamp current sensor and set up a trigger so that it is activated by the starting current. Use the scaling function so that current values can be read directly. Use a Hioki 9018 Clamp On Probe. The output rate will be 500 A AC 200 mV AC. You can also display trace cursors, use them to measure the maximum value and rush current time, and then use the parameter calculation function to calculate the maximum value.
1) Setting recording length
The recording length varies with the load, but here we will use a setting of 10 div. at 50 ms/div. to capture 0.5 s.
2) Setting input range
Since the clamp current sensor we’re using generates 200 mV AC output, set the 0 position to 50% using the 50 mV/div. range.
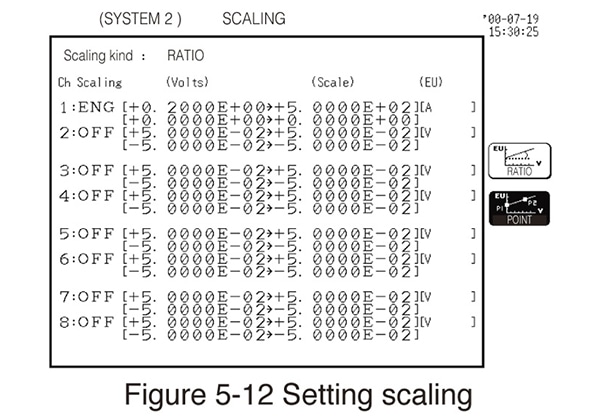
3) Making scaling settings
Select 2-point scaling on the system’s scaling settings screen and configure the settings as shown in Figure 5-12. Since use of the ENG setting in combination with scaling enables settings in units of 103 and 106, you can read values as indicative of units with a K, M, or G prefix.
Voltage Voltage values at 2-points
HIGH side 0.2000E+00 → 5.0000E+02 [A]
LOW side 0.0000E+00 → 0.0000E+00
4) Setting the trigger start point (Pre-trigger)
Since we need data after the trigger is activated, use a setting of 10%.
5) to 8) (Sama as “Measuring the input and output characteristics of DC power supply”)
6) Maximum value calculation
Set parameter calculation to “ON” on the status (settings) screen and specify a calculation for channel 1 only. Since data remains, moving the flashing cursor to the parameter calculation “ON” setting will cause an “EXECUTE” button to be displayed on the function key GUI display. Press that button. The maximum value calculation result will be displayed on the screen.