Addressing EMC Noise Early On: IEC Harmonics, Voltage-Fluctuations/Flicker, and High-Frequency Noise
Introduction
Electrical products must undergo harmonic and voltage-fluctuation/flicker tests to evaluate low-frequency emissions (EMC) related to power quality (outlined in IEC standards). In recent years, high-frequency noise has been recognized as an issue for not only industrial inverters, but also residential inverter-driven products.
This application note introduces IEC-compliant measurement of low-frequency emissions, specifically harmonics and voltage-fluctuation/flicker using the Power Analyzer PW8001. The article will describe the analysis of noise through measurement of high-frequency noise with this power analyzer.
Why test harmonics and voltage-fluctuation/flicker
In harmonics testing, measurement is performed on the distortion components of equipment’s current consumption waveforms. Since harmonic current causes increased risk of equipment malfunction and failure, and higher reactive power in power systems, standards stipulate testing be done to keep them below set values.
Since flickering lights can be a health hazard and also causes a great deal of discomfort, standards outline testing of the causes of flickering. Fluctuations in supply current resulting from variations in current consumption of various electrical products cause voltage fluctuations. These voltage fluctuations, in turn, cause lights to flicker. That is why, in the flicker test, the voltage fluctuation is tested against a prescribed limit .
IEC standards governing harmonic and voltage-fluctuation/flicker tests
Testing conditions and maximum value limits have been defined for different types of equipment and devices. Before designing a testing regime, the latest testing standards should be referenced. In addition, required specifications for the appropriate measuring equipment of the test changes based on the specific standard being observed. The Power Analyzer PW8001 complies with the standards used for IEC testing for harmonics, and voltage-fluctuation/flicker.
Harmonics testing standards supported by the Power Analyzer PW8001
- IEC 61000-3-2
- Testing of equipment with a rated current of 16 A or less per phase
- IEC 61000-3-12
- Testing of equipment with a rated current of greater than 16 A and not greater than 75 A per phase
- (The specifications of a measuring instrument that can be used for both of the standard-tests above are specified in the standard IEC 61000-4-7:2002. The PW8001 satisfies the specification requirements outlined in this standard for harmonic orders 0 to 200 and inter-harmonic orders 0.5 to 200.5.)
Voltage fluctuation and flicker testing standards supported by the Power Analyzer PW8001
- IEC 61000-3-3
- Testing of equipment with a rated current of 16 A or less per phase
- IEC 61000-3-11
- Testing of equipment with a rated current of greater than 16 A and not greater than 75 A per phase
- (The specifications of a measuring instrument that can be used for both of the standard-tests above are specified in the standard IEC 61000-4-15:2010. The PW8001 satisfies the specification requirements outlined in this standard (accuracy: Pst ±5% [Pst = 0.2 to 5]; dc, dmax: ±4% [when dmax = 4%])
Test system for harmonics and voltage-fluctuation/flicker test
Fig. 1 provides a block diagram of a testing system for harmonics and voltage-fluctuation/flicker testing. The IEC standards for harmonics and voltage-fluctuation/flicker testing require a system with an AC power supply and a reference impedance network (RIN). The power analyzer measures the voltage and current supplied to the equipment under test, then outputs measurement results in accordance with the measurement standard. Current is measured by a current sensor. Since there's no need to directly connect for current measurement, the effects of wiring and instrument loss can be reduced, allowing measurement to be carried out under conditions that better resemble the actual operating environment .
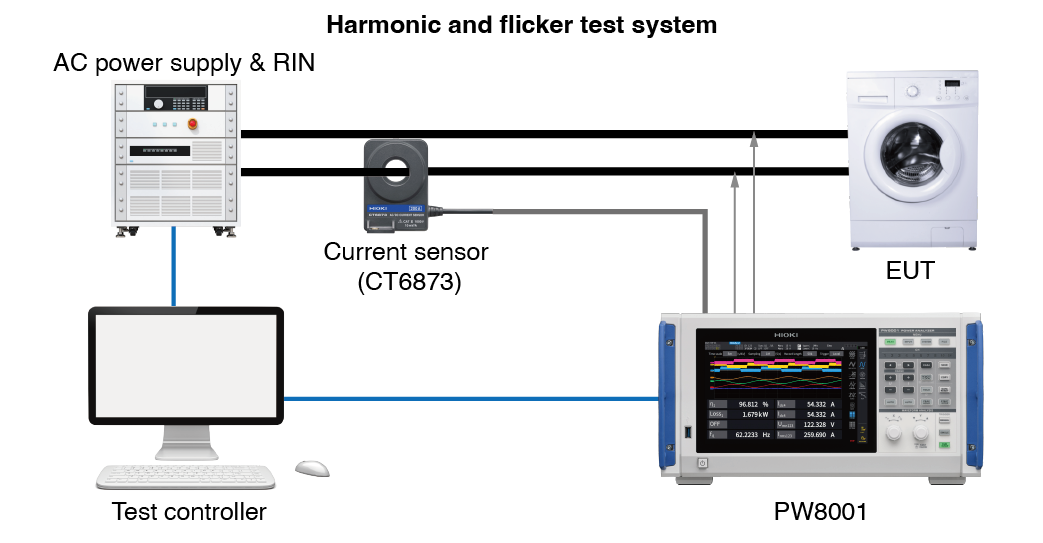 Fig. 1: Block diagram of a harmonic and voltage-fluctuation/flicker testing system
Issues with power supply noise
Harmonic and voltage-fluctuation/flicker testing is a type of low-frequency emissions testing. However, in extremely rare cases, switching noise from inverter-driven equipment may exceed anticipated levels and cause nearby equipment to malfunction*. To prevent development delays, it’s important to check for issues caused by power supply noise while addressing harmonics and voltage fluctuations early on in the equipment development process.
- *K. Nishijima, “Study on Conduction EMI Noise for EMC Filter Mounted on Switching Power Supply,” Journal of the Japan Institute of Power Electronics, vol. 45, pp. 106-112, June 2020.
Hioki measurement solution
The latest firmware for Hioki’s Power Analyzer PW8001 (Version 2.0) adds Power Spectrum Analysis (PSA) functionality as well as IEC harmonics and voltage-fluctuation/flicker measurement.
With a testing setup as illustrated in Figure 1, the PW8001 can be used to check harmonics and voltage fluctuations for IEC-standard-defined testing that judges limits. These tests are most useful when evaluating hardware at the start of development, allowing you to assess trends and address them early on. For example, say that you discover that changes to the design of a power supply circuit have resulted in increased harmonic current. In that case, deducing that the harmonic current would exceed the applicable limit in EMC testing, you can take noise-reduction countermeasures early on to avoid complicated problem solving later.
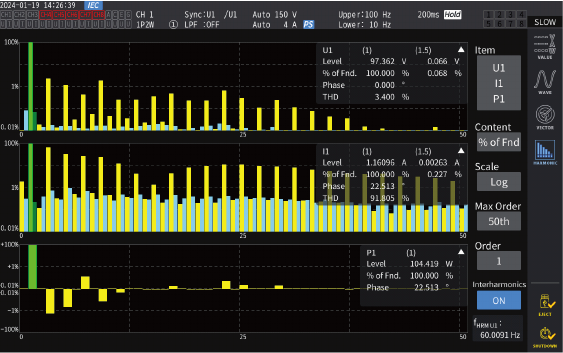
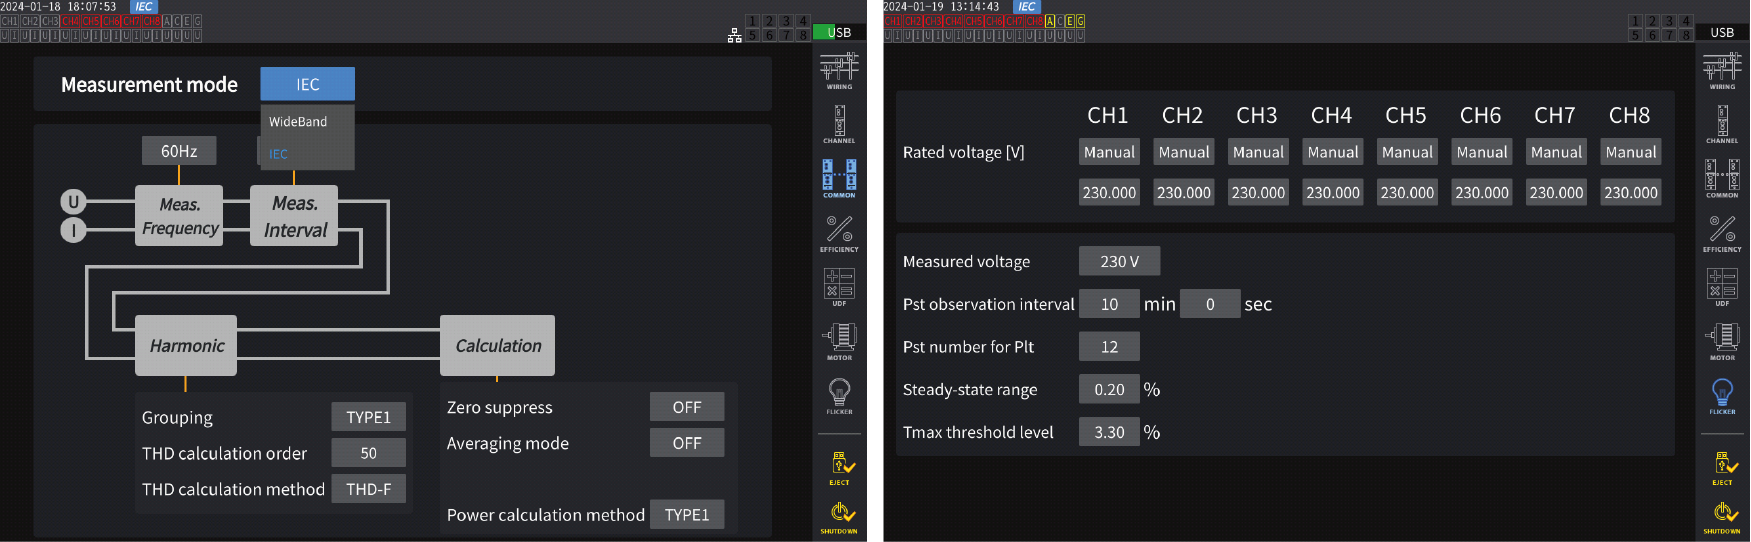 IEC harmonic measurement mode settings screen (left) and voltage-fluctuation/flicker testing mode settings screen (right)
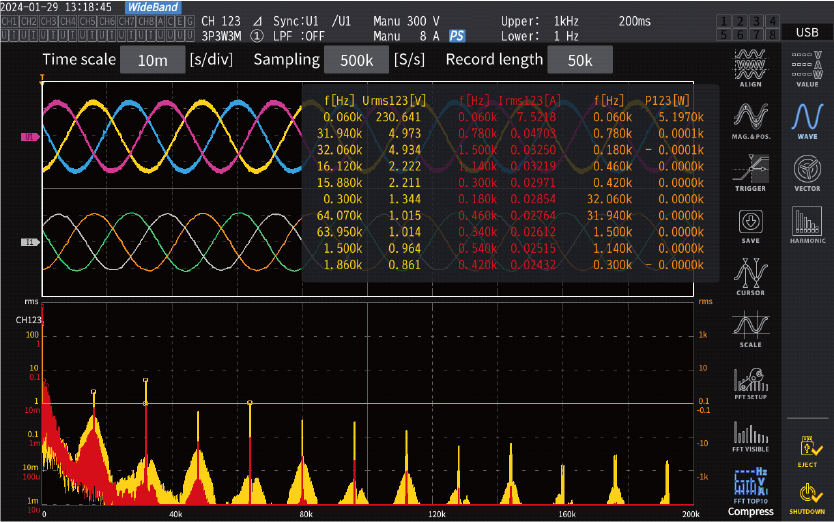
Power Spectrum Analysis (PSA) function
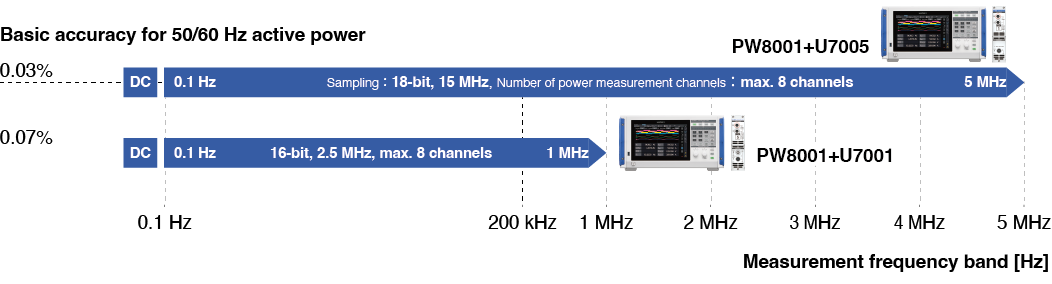
The Power Spectrum Analysis function, which can perform FFT analysis of voltage, current, and power, lets you analyze noise at higher frequencies (up to 6 MHz) than is possible with traditional harmonic analysis. This allows you to visually check for noise that would go undetected in IEC harmonic or voltage-fluctuation/flicker measurement. The PW8001 itself features guaranteed accuracy of high frequency power measurement (up to 1 MHz), making it extremely reliable in evaluating high-frequency conductive noise caused by inverters and switching power supplies.
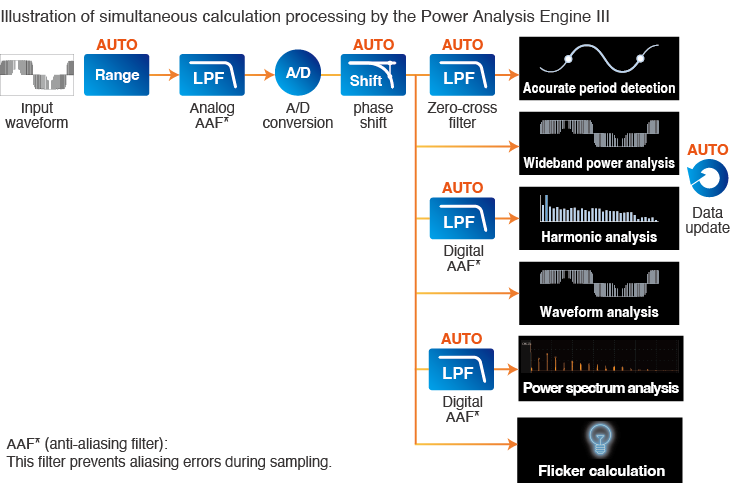
Six types of automatic settings provided by Hioki’s state-of-the-art power analysis engine
The PW8001 performs accurate power measurement along with all calculations (including harmonics analysis and Power Spectrum Analysis) simultaneously and in parallel. Furthermore, the PW8001, utilizes a state-of-the-art power analysis engine (Power Analysis Engine III) which automatically optimizes settings such as measurement ranges and filter characteristics. This makes sure that the magnitude and frequency of input waveforms are optimized for accurate measured during a single measurement cycle, allowing multifaceted verification. (All six of these settings are illustrated in the figure below with the red letters “AUTO.”).
Example product configuration
The Power Analyzer PW8001 supports two types of input modules which can be chosen based on the measurement application. In addition, Hioki offers an extensive selection of current sensors with current ratings ranging from 2 A to 2000 A. The two types of input modules can be mixed and matched (max. 8 channels) depending on factors such as required measurement accuracy and measurement frequency band.
Accuracy when combined with Hioki current sensors
Hioki is the only manufacturer in the industry that develops and manufactures both its own high-performance current sensors and power analyzers. This results in one of Hioki’s edges against competitors comes in in the form of exceptional accuracy. In short, Hioki can tailor-make the measuring instruments to counteract the loss in accuracy resulting from phase error that notoriously haunts high frequency measurement with CT sensors. Furthermore, as shown in Table 1, Hioki’s current sensors feature accuracy defined not only at 50/60 Hz but also up to high frequencies. This also contributes to them being extremely effective choices for use in harmonic and noise analysis.
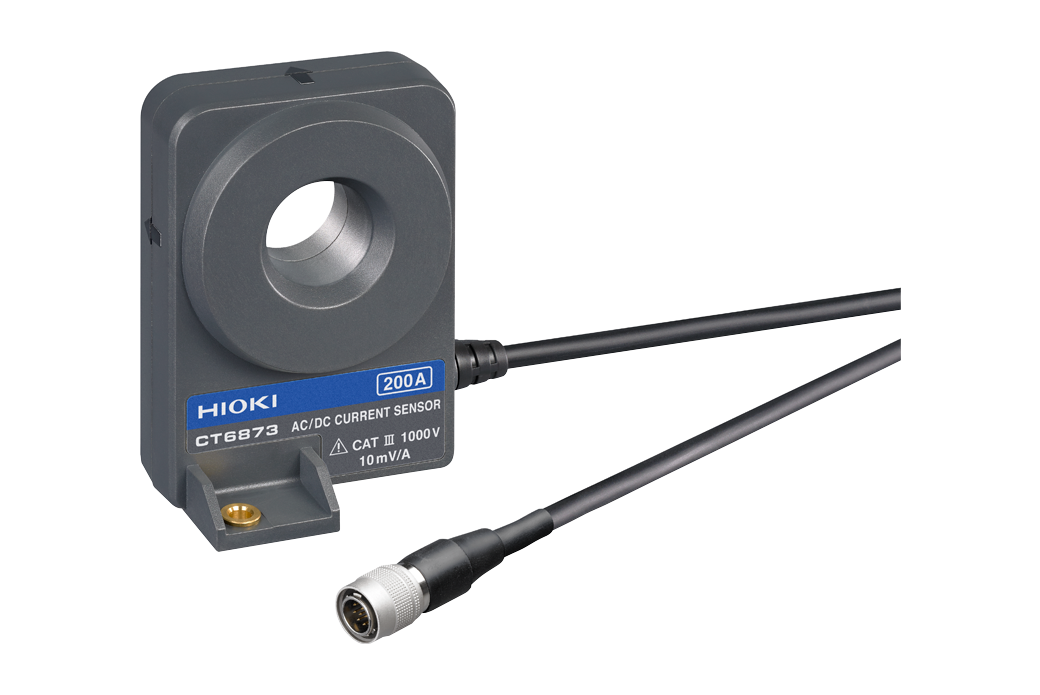 AC/DC Current Sensor CT6873 (200 A)
Table 1: examples of combination accuracy for the PW8001 and current sensor (CT6873)
| Instrument combination | Frequency: ±% of range |
|---|---|
| PW8001 + U7001 + current sensor (CT6873) |
|
| PW8001 + U7005 + current sensor (CT6873) |
|
- *The current sensor rating is taken into account when calculating the full-scale error. Please refer to the instruction manual for the accuracy of other frequencies.
Specification overview of measurement modes
Table 2 provides an overview of the measurement specifications for the PW8001’s IEC harmonics mode. The display is intuitive and easy to read because it divides the harmonic orders between even and odd numbers. Tables 3 and 4 provide a specification overview of flicker measurement and Power Spectrum Analysis (power FFT), respectively.
Table 2: overview of the measurement specifications for the PW8001’s IEC harmonics mode
| Item | Specifications |
|---|---|
| Measurement method | Compliant with IEC 61000-4-7:2002; no gaps or overlaps |
| Measurement frequency settings | 50 Hz, 60 Hz |
| Synchronous frequency range |
|
| Data refresh rate | Fixed at approx. 200 ms (50 Hz: 10 cycles; 60 Hz: 12 cycles) |
| Analysis orders |
|
| Number of window waves | 50 Hz: 10 cycles; 60 Hz: 12 cycles |
| Number of FFT points | 8192 points |
| Measurement accuracy | Add ±0.04% of the range to each of the basic accuracies for the module in use ( voltage, current, power, and phase). For a frequency of 10 kHz or more, add another ±0.04% of the range. (Accuracy is only assured for harmonic analysis when the fundamental frequency is within the synchronous frequency range.) |
Table 3: Overview of flicker measurement specifications
| Item | Specifications |
|---|---|
| Measurement channels | Max. 8 |
| Measurement method | Compliant with IEC 61000-4-15:2010 Ed 2.0 Flickermeter Class F2 |
| Flicker measurement items |
|
| Measurement frequencies | 50 Hz, 60 Hz (measurable in IEC measurement mode only) |
| Measurement range | Pst and Plt: 0.0001 P.U. to 6,400 P.U. (logarithmic 1400-way split) |
| Flicker filter | 230 V lamp, 120 V lamp |
| Measurement accuracy |
|
Table 4: Overview of the specifications for Power Spectrum Analysis (PSA) function
| Item | Specifications |
|---|---|
| Measurement channels |
|
| Calculation type |
|
| Number of possible FFT points | 1,000/5,000/10,000/50,000/100,000/500,000/1,000,000/5,000,000 |
| Anti-aliasing | Digital filter is applied automatically |
| Window function | Rectangular, hamming, flat top |
| Maximum analysis frequency |
|
Conclusion
The PW8001 can measure harmonics and voltage-fluctuations/flicker in accordance with IEC standards. By using the Power Spectrum Analysis (PSA) early on in development, developers can avoid delays from later discovering and having to fix excessive power supply noise or switching noise.
For comprehensive details on the Power Analyzer PW8001, please visit the product page. For inquiries such as quotes, demonstrations, and trial usage, please use Hioki’s contact form for a personalized reply from your closest or most appropriate Hioki representative. We are here to help tailor solutions to your needs.