Why High-Frequency Ringing Power Matters in SiC and GaN Motor Efficiency Measurement
Introduction
Have you ever measured motor efficiency at low load and obtained a value greater than 100%? Or found a persistent gap between measured efficiency and your expected result?
Faster voltage transitions from SiC and GaN switching devices can excite voltage and current components extending into the megahertz range. At these frequencies, the bandwidth and phase characteristics of the complete measurement system—including the power analyzer and current sensor—can directly affect active-power measurement accuracy.
Low-pass filtering can also remove high-frequency voltage and current components that contribute to measured active power. If the measurement system does not capture these components, measured motor electrical input power can be biased low, causing calculated efficiency to increase.
This application note examines one mechanism behind this measurement problem: active power associated with high-frequency ringing. It also shows how power spectrum analysis (PSA) can identify these components and why wideband measurement-system performance becomes especially important at low motor load.
Ringing power: Active power at the ringing frequency [1], [2]
The use of faster-switching devices continues to increase as inverter designers pursue higher efficiency and power density. In particular, SiC and GaN wide-bandgap (WBG) semiconductors produce shorter voltage rise times than conventional Si-based switching devices.
These fast voltage transitions can excite resonances caused by the parasitic elements of the motor and the cable between the inverter and motor. The resulting transient oscillation is called ringing.
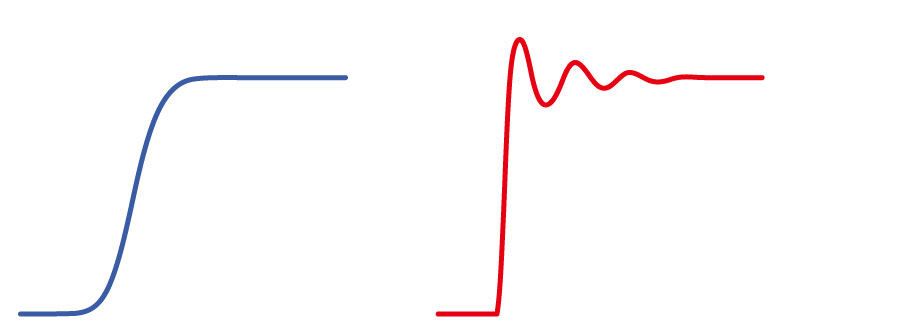 Fig. 1. Effect of switching rise time on ringing.
Left: Slower rise time with little ringing.
Right: Faster rise time with ringing.
The high-frequency voltage and current components associated with ringing can produce active power at the ringing frequency. In this article, we call this active-power component ringing power.
When ringing power contributes to the motor input power, a measurement system must capture this component to measure the total input power correctly.
How ringing power is generated
Consider an equivalent circuit representing one phase of a motor winding.
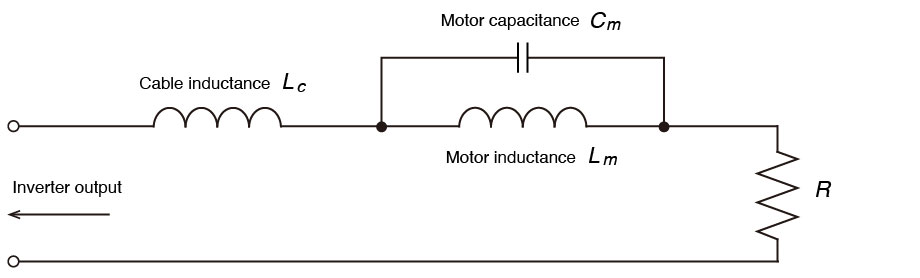 Fig. 2. Simplified equivalent circuit of one motor phase.
The interaction between the cable inductance and motor capacitance creates resonant behavior at specific frequencies. Switching excites resonant circuits, causing high-frequency voltage and current oscillations to appear at the motor terminals.
As shown below, ringing can appear at both the inverter output and motor terminals, with its amplitude depending on the cable and motor impedance characteristics.
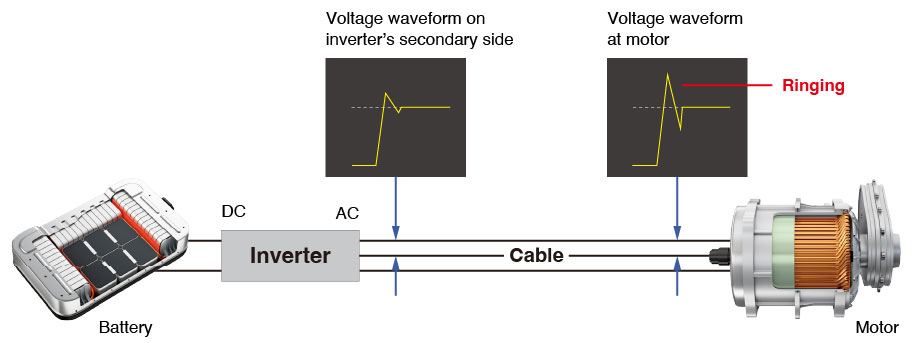 Fig. 3. Typical location of ringing in an inverter–motor system.
The following waveform shows an enlarged view of ringing at the inverter output.
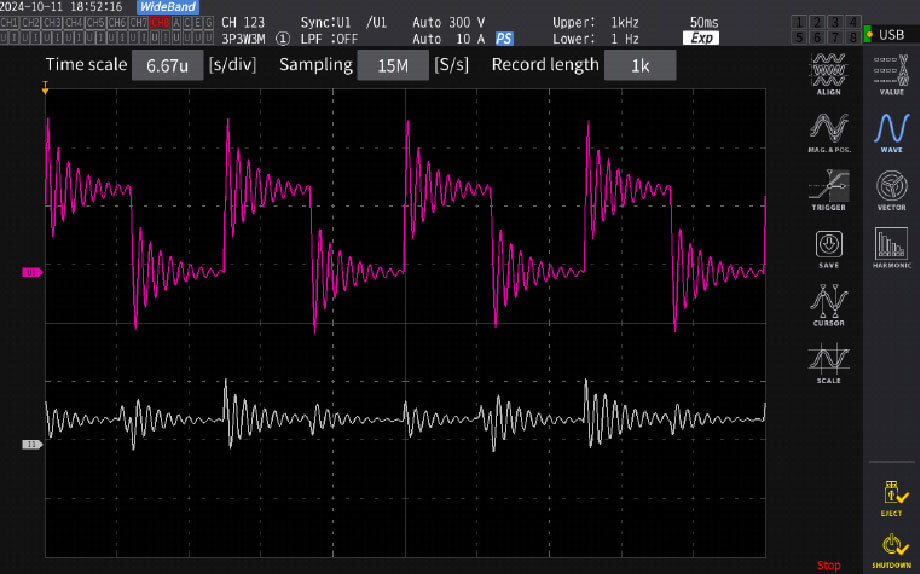 Fig. 4. Enlarged ringing waveform on the inverter output side (PW8001 + U7005 + CT6904A) .
Pink: U–V line-to-line voltage. White: U-phase current.
Why conventional motor power measurement can miss ringing power
IGBT (Insulated Gate Bipolar Transistor) have long been used for inverter switching. Compared with SiC and GaN devices, conventional IGBT-based motor drives generally have slower voltage transitions. As a result, conventional motor-drive power measurement has not always required measurement-system performance extending into the megahertz range.
SiC and GaN WBG semiconductors, however, switch faster and can excite higher-frequency resonances in the inverter–cable–motor system.
The frequency components of the electrical power measured at the inverter output—the motor electrical input—are illustrated below. Ringing power, shown in green, appears at frequencies above the carrier-frequency component and its harmonics, shown in pink.
At these frequencies, voltage and current may have a low power factor. Even a small phase error between the voltage and current measurement paths can therefore produce a significant active-power error.
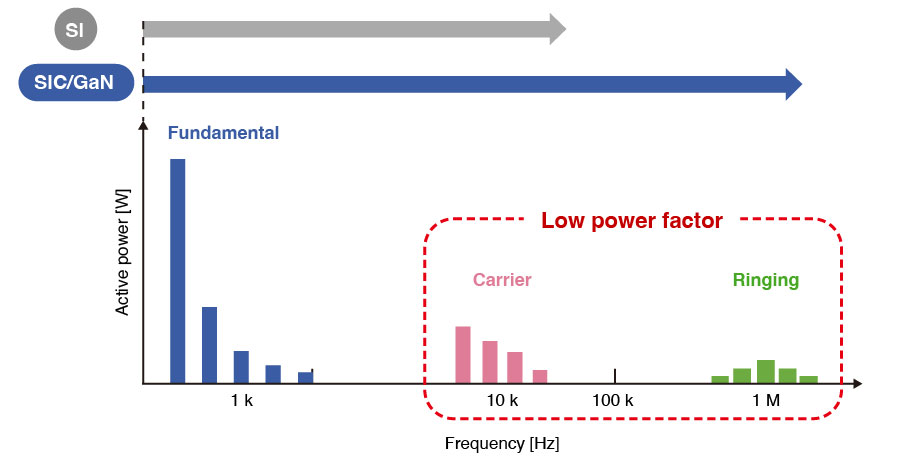 Fig. 5. Conceptual distribution of active power by frequency.
Why high-frequency power matters more at low load
Switching-frequency components, harmonics, sidebands, and ringing-related power remain present across motor operating points, although their absolute magnitudes vary.
At low motor load, fundamental motor input power decreases. The high-frequency components can account for a larger proportion of the total measured input power.
For this reason, errors in measuring these high-frequency components can have a greater effect on calculated inverter and motor efficiency at low load.
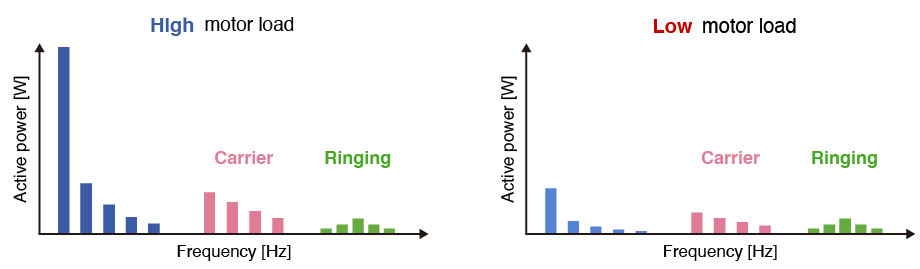 Fig. 6. At low motor load, high-frequency active-power components can represent a larger share of total motor input power.
Measurement-system requirements for SiC/GaN inverters and motors
Accurate high-frequency power measurement requires sufficient bandwidth and well-characterized phase performance across the relevant frequency range.
These requirements apply to the complete measurement system, including both the power analyzer and the current sensor.
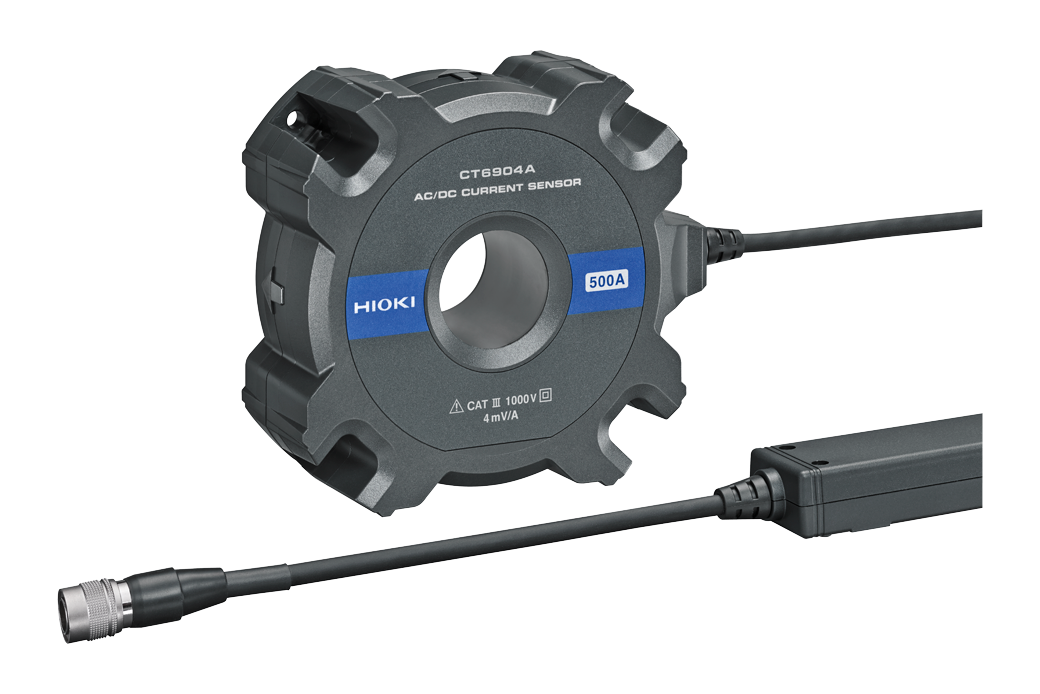
The PW8001 with the U7005 input unit provides a 5 MHz measurement bandwidth, while the CT6904A current sensor provides a 4 MHz bandwidth. Hioki also specifies the phase characteristics of the analyzer–sensor combination.
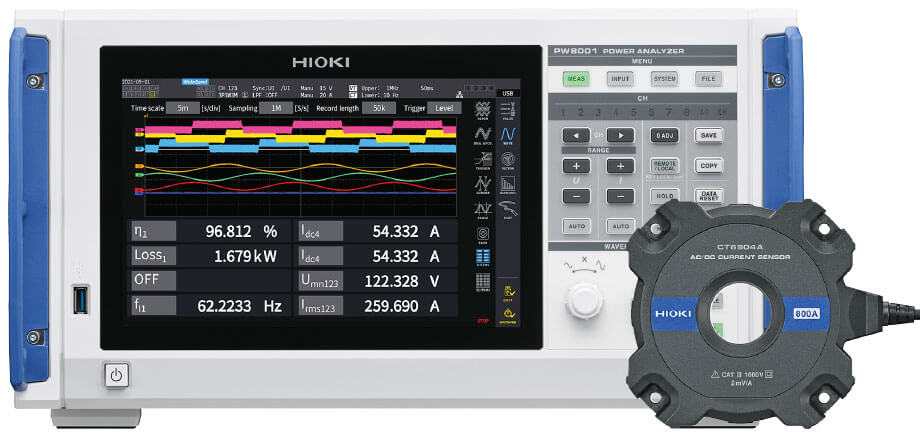
These characteristics allow the system to measure active power in high-frequency, low-power-factor conditions where phase error directly affects calculated power.
Visualizing ringing power using power spectrum analysis (PSA)
Conventional fast Fourier transform (FFT) analysis typically examines voltage and current spectra. Power spectrum analysis (PSA) calculates active power as a function of frequency, in addition to voltage and current spectra.
This lets engineers identify the frequency ranges where active power exists and quantify the power associated with those components.
We used this function to measure a SiC inverter under the following conditions:
- Switching frequency: 30 kHz
- Motor speed: 1000 r/min
The PSA result showed ringing power in the 1 MHz to 2 MHz range.
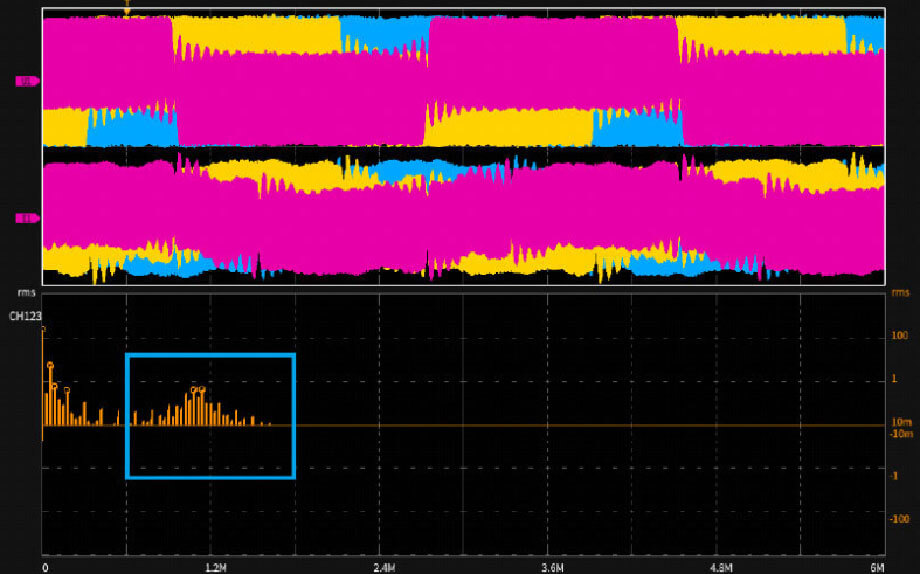 Fig. 7. PSA identifies active-power components in the approximately 1 MHz to 2 MHz frequency range associated with the observed ringing.
The PSA result shows active power in the same frequency range as the observed ringing.
Measurement comparison using motor efficiency maps
We compared the Hioki measurement system with another power analyzer and current sensor, identified here as Competitor A.
Measurement setup
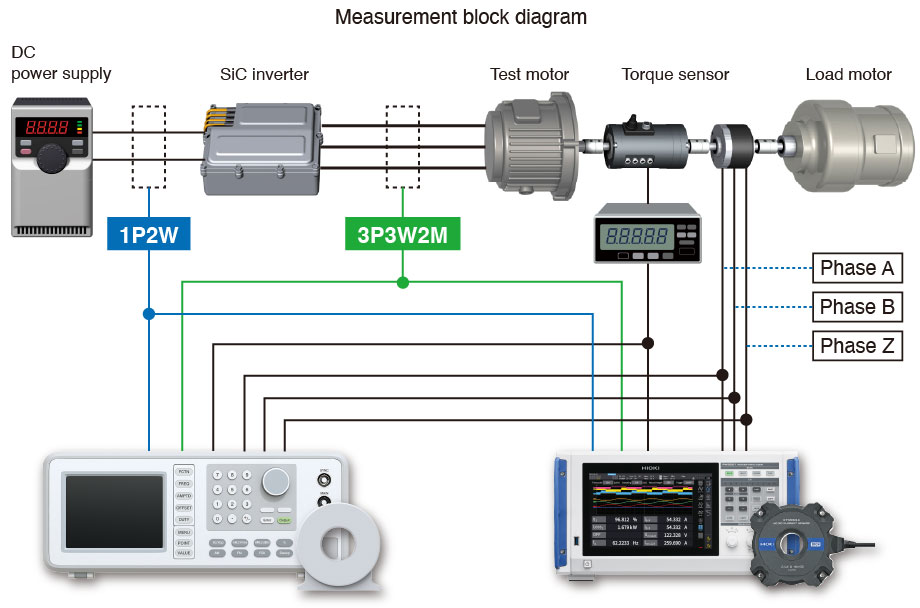 Fig. 8. Measurement block diagram.
| Measurement System | Competitor A | Hioki |
|---|---|---|
| Power analyzer bandwidth | Up to 2 MHz | PW8001 + U7005: 5 MHz |
| Current sensor bandwidth | Approx. 300 kHz | CT6904A: 4 MHz |
| Sensor phase correction | Manual correction value | Automatic phase correction |
| Filters | OFF | OFF |
Other settings (common to both measurements)
- Measurement interval: 200 ms
- Synchronization source: I1 (inverter current)
For the CT6904A, the PW8001 applied automatic current-sensor phase correction. For the Competitor A current sensor, the manufacturer-supplied correction value was entered manually.
DUT (Device Under Test) Information
- Test motor: Fuji Electric Co., Ltd. GNF2117A
- Inverter: Myway Plus Inc. MWINV-5044-SIC
- Switching frequency: 30 kHz
- DC input voltage: 300 V
Measurement results
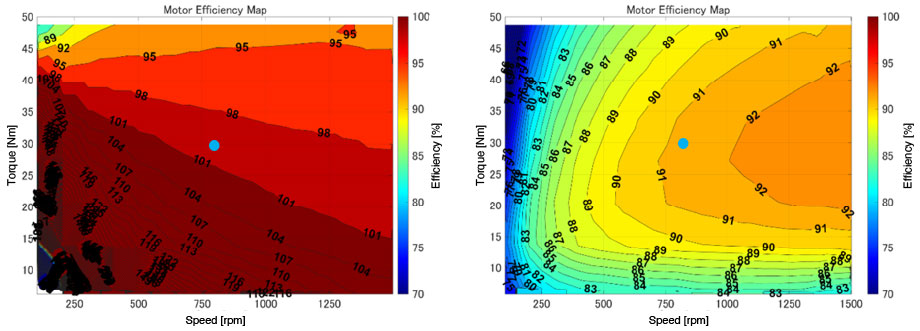 Fig. 9. Motor-efficiency maps.
Left: Competitor A power analyzer and current sensor.
Right: PW8001 with U7005 and CT6904A.
Blue marker indicates the operating point summarized in TABLE I.
TABLE I
Motor efficiency measurement results at 27 N·m and 803 r/min
| Competitor A | Hioki | |
|---|---|---|
| Mechanical output | 2,303 W | 2,289 W |
| Motor electrical input | 2,290 W | 2,505 W |
| Motor loss | -13 W | 216 W |
| Calculated efficiency | 100.6% | 91.4% |
At the operating point of 27 N·m and 803 r/min, the measured mechanical output power agreed closely between the two measurement systems, with a difference of only about 14 W. In contrast, the measured motor input power differed by 215 W: 2,290 W with Competitor A's measurement system and 2,505 W with the Hioki measurement system.
As a result of this difference, the calculated motor efficiency was 100.6% with Competitor A's system, whereas the Hioki measurement system yielded an efficiency of 91.4%.
The comparison does not isolate a single error source. Competitor A used a current sensor with an approximate bandwidth of 300 kHz, while the ringing-related active-power components PSA observed extended into the 1 MHz to 2 MHz range. Differences in measurement bandwidth and phase characteristics can therefore affect the measured high-frequency active power and, in turn, the calculated motor efficiency.
The Hioki measurement system combines the PW8001, U7005, and CT6904A with 5 MHz analyzer bandwidth, 4 MHz current-sensor bandwidth, and current-sensor phase correction. These characteristics reduce measurement error when high-frequency, low-power-factor components are present.
Conclusion
SiC and GaN devices enable faster switching, but they also extend relevant power components into frequency ranges that conventional motor-drive measurements may not fully capture.
Ringing is not only a waveform phenomenon. Voltage and current components associated with ringing can contain active power, and PSA lets you identify where that power occurs in the frequency domain.
At low motor load, errors in high-frequency power measurement can greatly affect calculated efficiency because the electrical input power itself is small.
Accurate motor-drive power measurement therefore requires engineers to evaluate the complete measurement system, including analyzer bandwidth, current-sensor bandwidth, and phase characteristics.
If your SiC/GaN motor-efficiency measurements show unexpected low-load behavior, contact Hioki to review the bandwidth and phase performance of your measurement setup.
For detailed product information, please visit our website.
For a demonstration or consultation on a specific application, please contact us.
Related materials
Application notes
To inverter/motor developers focusing on a 0.1% efficiency improvement
Investigation of Inverter Motor Loss Using the Power Spectrum Analysis (PSA) Function
Comparison of SiC Inverters Measured by High-end Power Analyzers
Technical notes
Calibration of Wideband Low Power-Factor Power Using Calorimetric Method
Video
References
[1] M. Akahane, K. Hayashi, and K. Akatsu, “Proposal and Validation of a Ringing Loss Analysis Model for PWM Inverter-Driven Motor Systems,” presented at the International Power Electronics Conference (IPEC-ECCE Asia), Nagasaki, Japan, May–Jun 2026.
[2] M. Akahane, M. Nakamura, K. Hayashi, S. Yamada, and S. Obara, “Evaluation of effect of motor bench system on motor and inverter efficiency measurement using precision wide-band power analyzer,” IEEE Energy Conversion Congress and Exposition (ECCE), 2025.