Nyquist Plot for Impedance Measurement of Lithium-ion Batteries
What is the Nyquist plot (Cole-Cole plot)?
A Nyquist plot is a graph that plots impedance values measured at multiple frequencies. Impedance is a parameter that contains the resistance and reactance components.

Fig. 1: Typical Nyquist plot of internal resistance of a Lithium-ion battery
What is the impedance measurement method?
It is a method of measuring impedance by applying an AC signal. The AC signal used to measure the impedance of a battery usually has a fixed frequency of 1 kHz. There is also a method for measuring impedance using several frequencies as opposed to a single frequency. It is called Electrochemical Impedance Spectroscopy, or EIS. This method does not require disassembling the battery so it provides a safe and non-destructive way to observe the behavior inside a battery.
The internal resistance of the battery in general can be broadly divided into the following three categories.
1. Electrolyte resistance
2. Reaction resistance
3. Diffusion resistance
As shown in Fig. 2, the physical phenomena that dominate impedance differ depending on the frequency band. For example, the impedance at high frequencies (about 1 kHz) is mostly caused by Lithium-ion migration in the electrolyte. Lithium-ion diffusion occurs within the electrode at low frequencies (less than 1 Hz) and Li-ion transfer reactions at intermediate frequencies (1 to several hundreds of Hz). In other words, a detailed analysis of the Nyquist plot allows us to evaluate various phenomena in different parts of the battery.
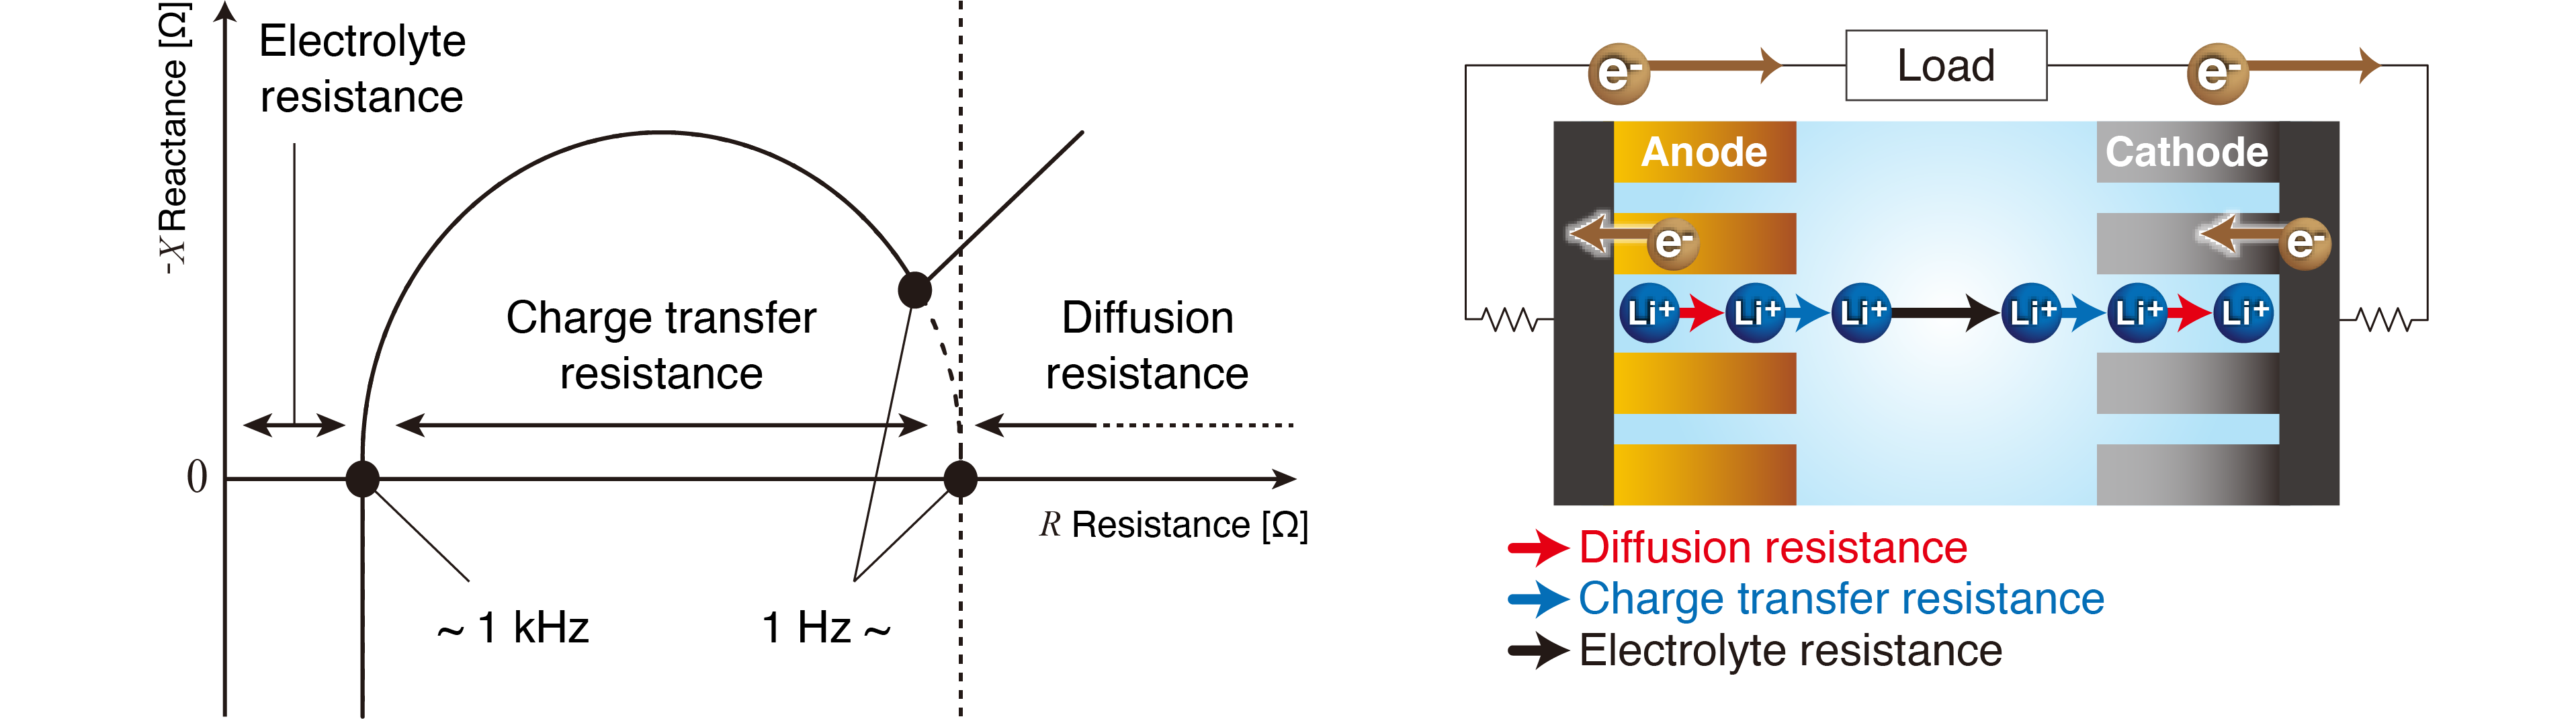
Fig. 2: Typical relation between Nyquist plot and internal resistance of a battery
A typical analysis method is known as equivalent circuit analysis, which uses an equivalent circuit model as shown in Fig. 3. In the circuit model, each phenomenon inside the battery is modeled by different equivalent circuit elements. The element values calculated by the analysis can be considered to indicate the characteristics of the physical phenomena represented by the elements.
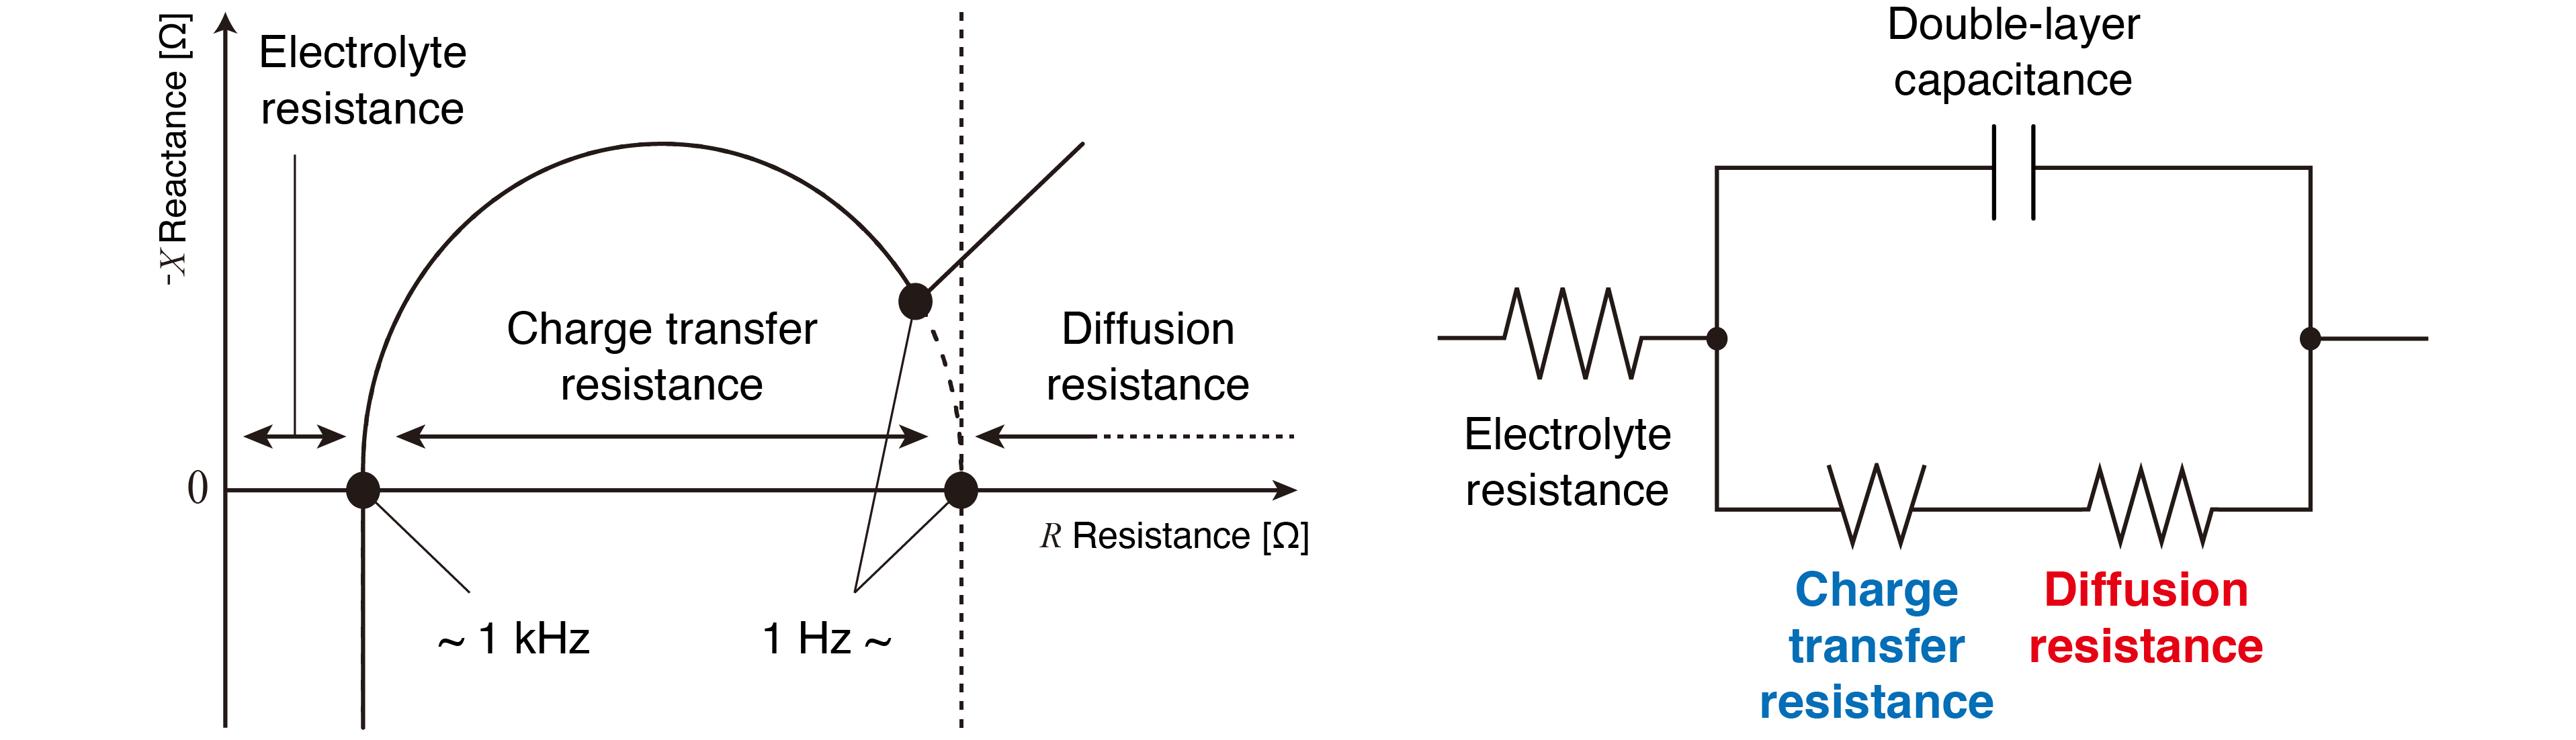
Fig. 3: Example of Nyquist Plot and Equivalent Circuit Model
Applications
1. Checking the battery deterioration level
As shown in Fig. 4, there is a significant difference in the reaction resistance between a pristine and a degraded Lithium-ion battery. In applications that involve charging and discharging at low temperatures or deep charging and discharging (SOC between 0% and 100%), degradation is likely to occur. The degradation of charge transfer resistance is particularly noticeable in the Nyquist plot as reaction resistance.
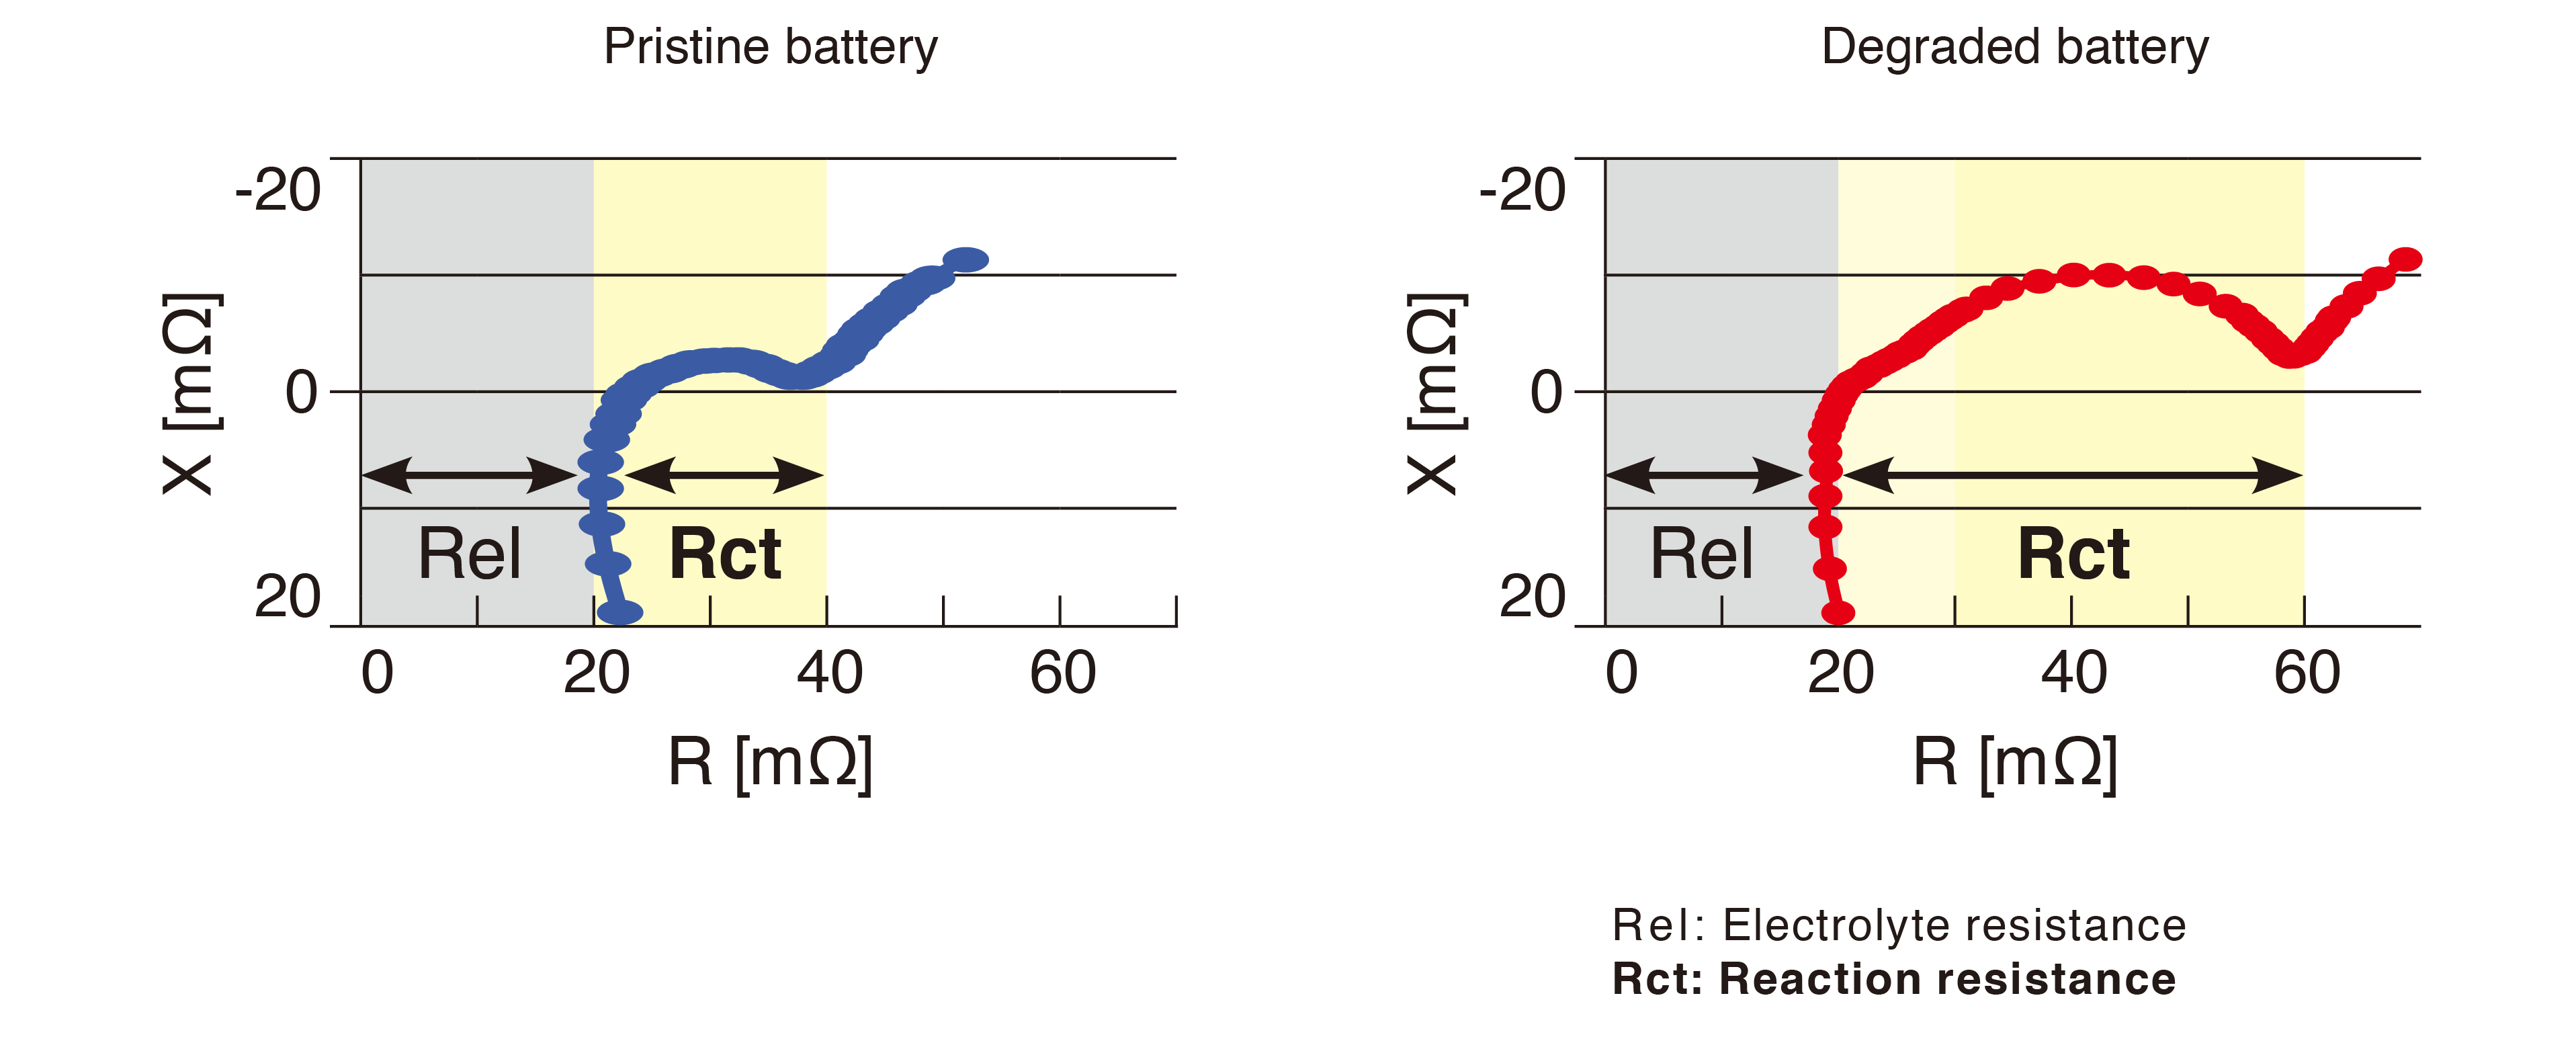
Fig. 4: Comparing the measured data for pristine and deteriorated lithium-ion batteries with the Nyquist plot
2. Identify battery deterioration factors
The causes of battery cell defects can be identified by measuring AC impedance at multiple frequencies. For example,
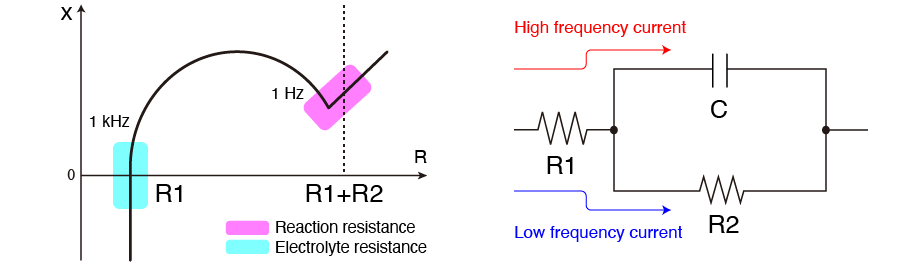
When R1 is larger: Decreasing in electrolyte concentration, or the electrode might have poor welding.
When R2 is larger: A failure might have occurred during the electrode production process, or the electrode might react poorly on its surface.
Solutions proposed by Hioki
Measuring instruments
| Product model | BT4560-50 | BT4560-60 | IM3590 | IM3536-01+9268-10 |
|---|---|---|---|---|
| Purpose | For cell production line | For R&D (Research and Development) | For R&D (Research and Development) | For R&D (Research and Development) |
| Appropriate battery type | All-solid-state battery, Liquid electrolyte lithium-ion battery | All-solid-state battery, Liquid electrolyte lithium-ion battery | All-solid-state battery | All-solid-state battery |
| Measurable battery voltage | 5 V max. | 5 V max. | 5 V max. | 10 V max. |
| Frequency range | 0.01 Hz to 1050 Hz | 0.01 Hz to 10.00 kHz | 1 mHz to 200 kHz | 4 Hz to 10 MHz |
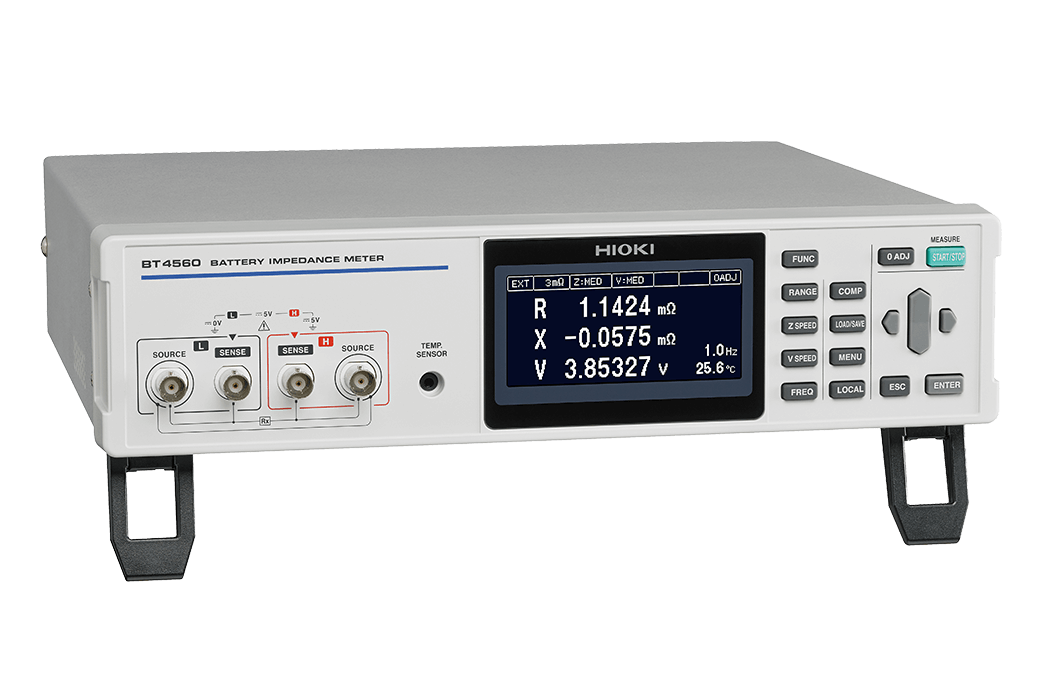
BATTERY IMPEDANCE METER BT4560-50
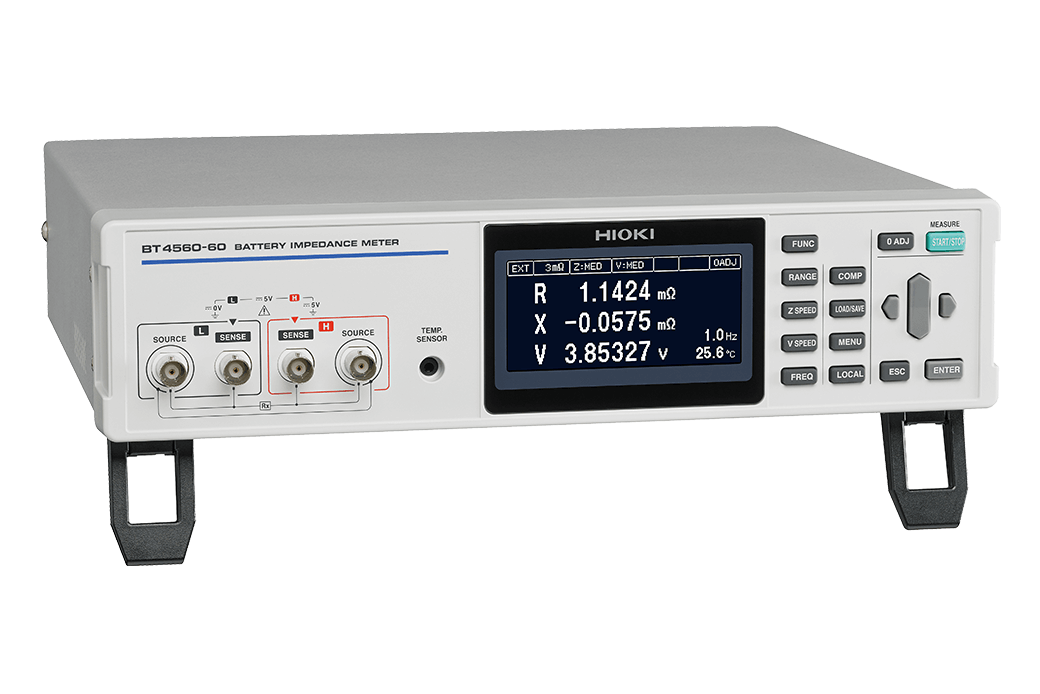
BATTERY IMPEDANCE METER BT4560-60
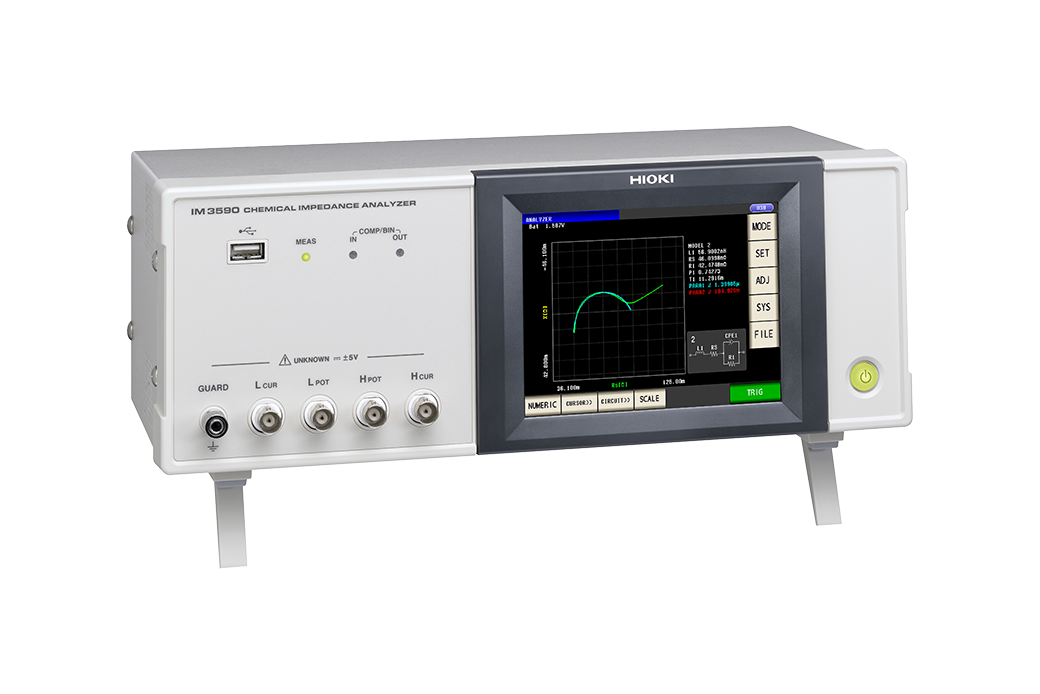
CHEMICAL IMPEDANCE ANALYZER IM3590
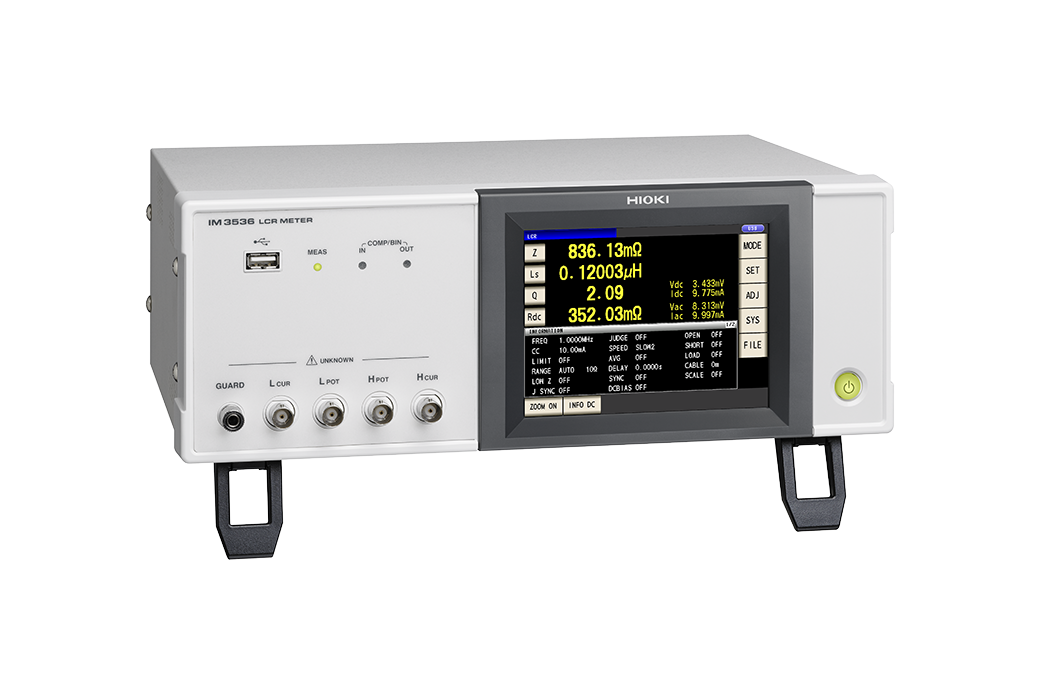
LCR METER IM3536
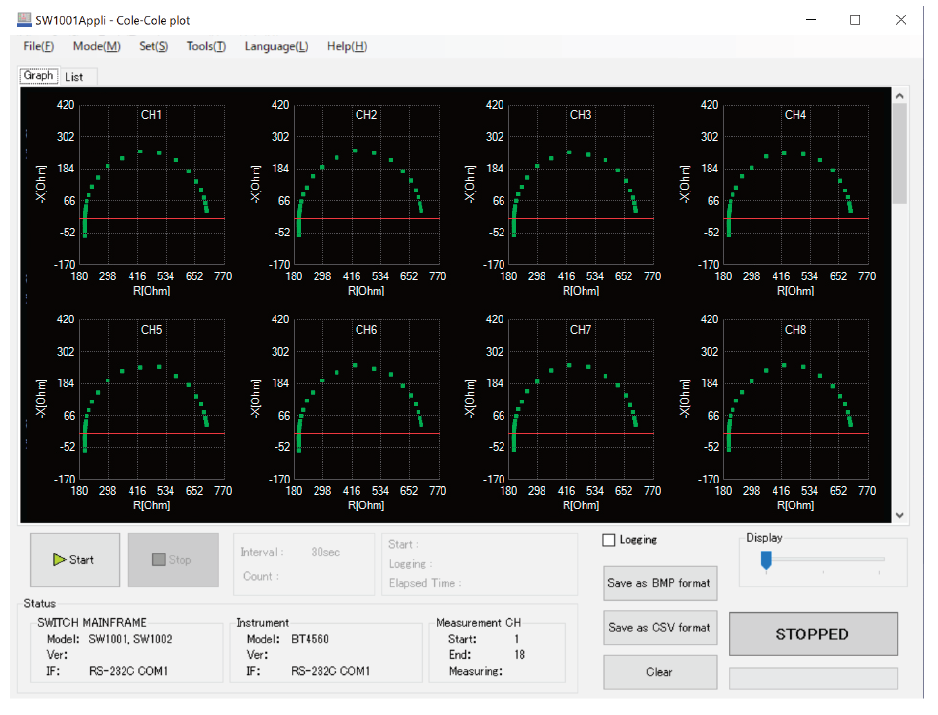
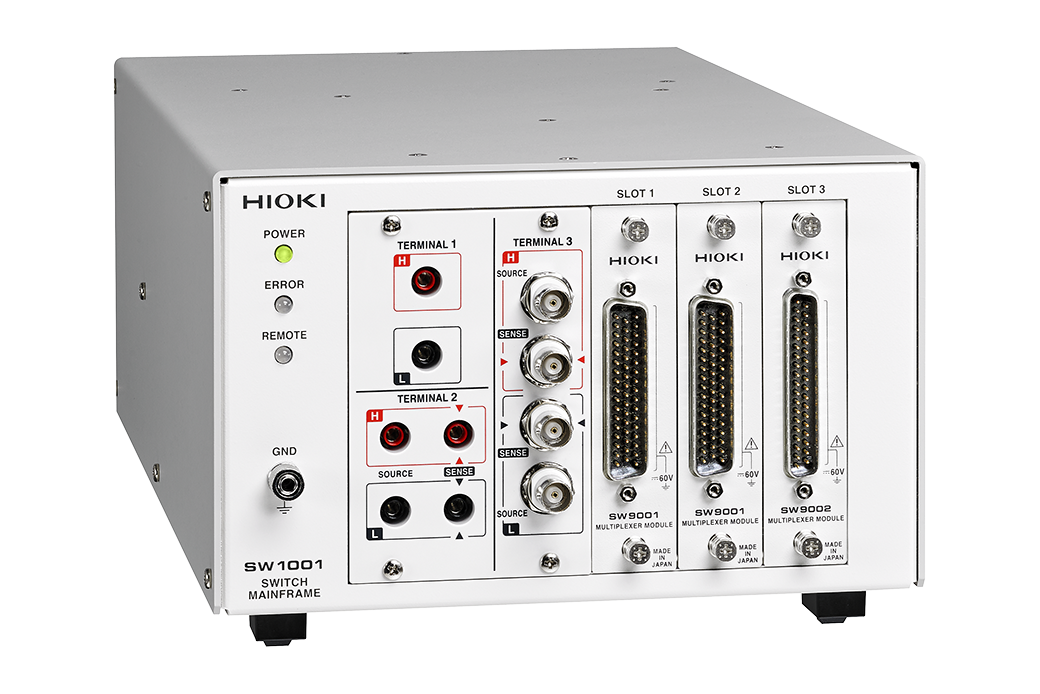
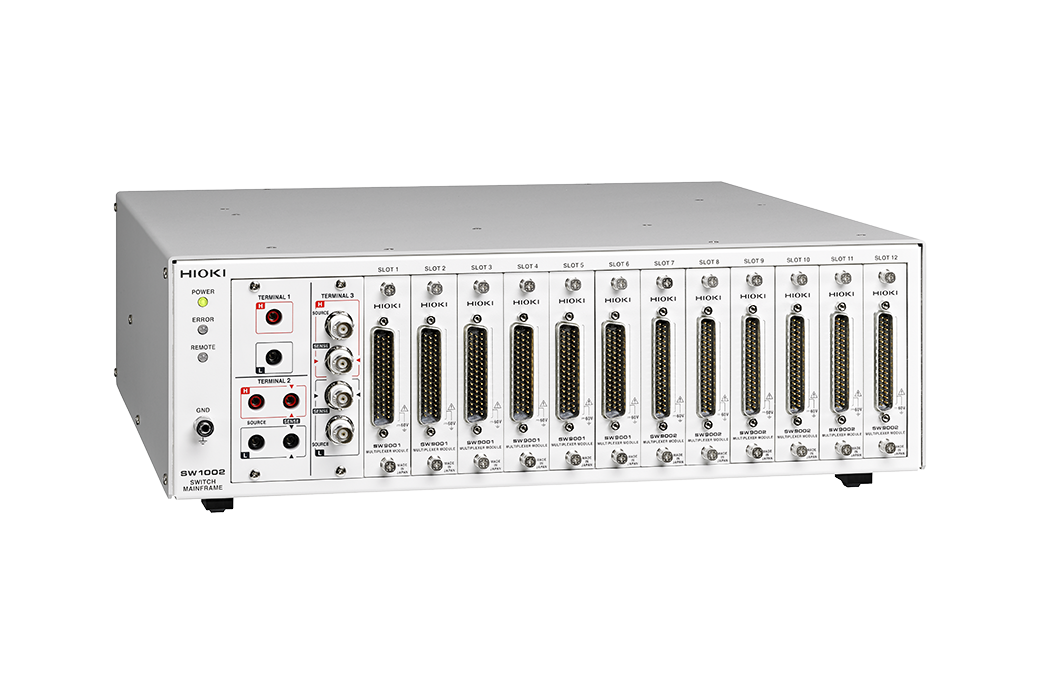
Multiple measurement and evaluation
The SW1001 and SW1002 are switch mainframes for multiplexer modules that let you test batteries quickly and on more than one channel. Use one of them in combination with the BT4560 series or the IM3590 to perform multi-channel Nyquist plot measurements.
Sustainable society cannot be realized without the development and production of high-quality batteries. We at Hioki offer a wide range of battery measurement solutions.