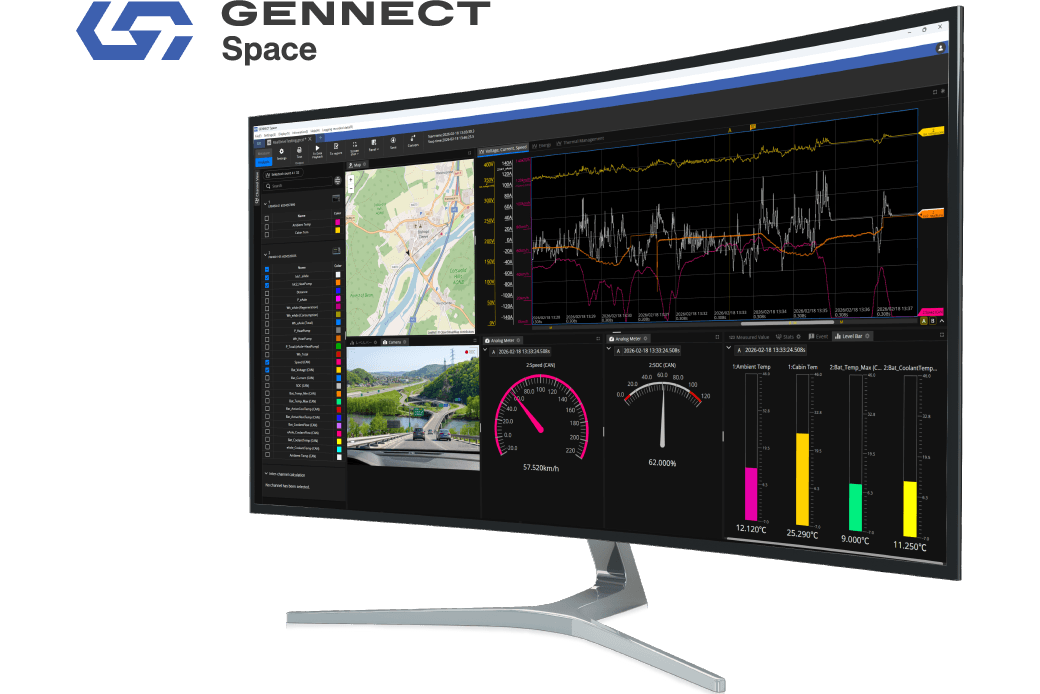
What’s New in GENNECT Space V1.5
Spend less time organizing data.
Move faster from measurement to decisions.
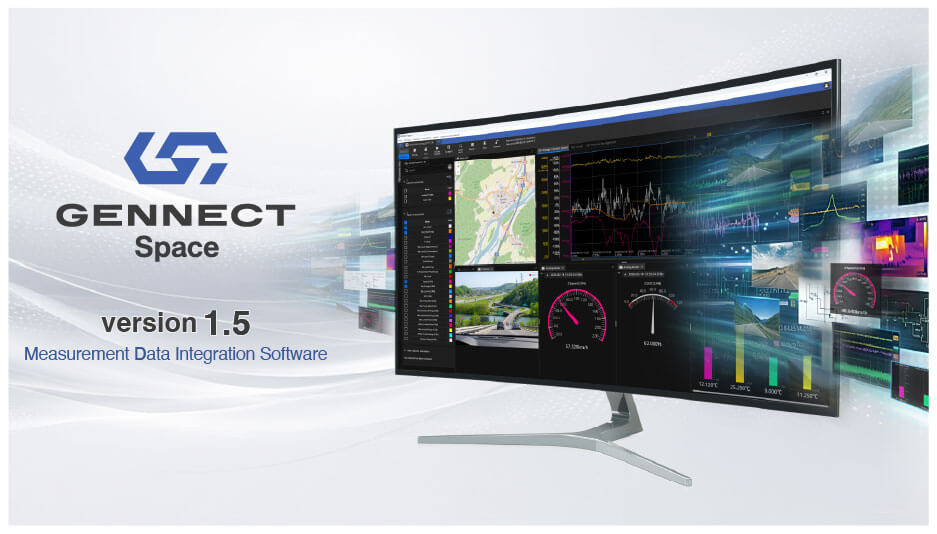
GENNECT Space V1.5 is here.
Version 1.5 helps engineers move faster after measurement. Import data saved on supported HIOKI instruments, compare multiple data sets, visualize changing values, check statistics, and export data in ASAM MDF format for external analysis workflows.
GENNECT Space V1.5 gives you a smoother way to review, analyze, and share measurement data.
Measurement Data Integration Software
GENNECT Space
Bring measurement data into one workspace
Modern testing rarely ends with a single waveform.
Engineers often need to review high-speed signals, temperature trends, calculated values, video, and location information together. They also need to compare results, find abnormal behavior, and prepare data for reports or external analysis tools.
GENNECT Space brings these data sources into one workspace, so you can connect measurement results with the real-world events behind them.
With Version 1.5, that workflow becomes even stronger.
Reduce post-measurement review time
Bring recorded instrument data back into GENNECT Space.
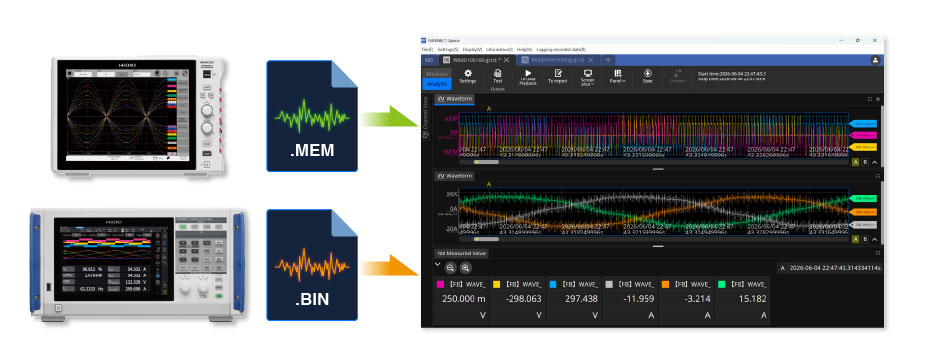
Version 1.5 lets you import MEM and BIN files saved on supported HIOKI instruments. Instead of checking files separately or switching between different tools, you can review recorded data in the same environment used for analysis and reporting.
This helps shorten the time between measurement and review, especially when you work with multiple instruments or large data sets.
Compare more data with confidence
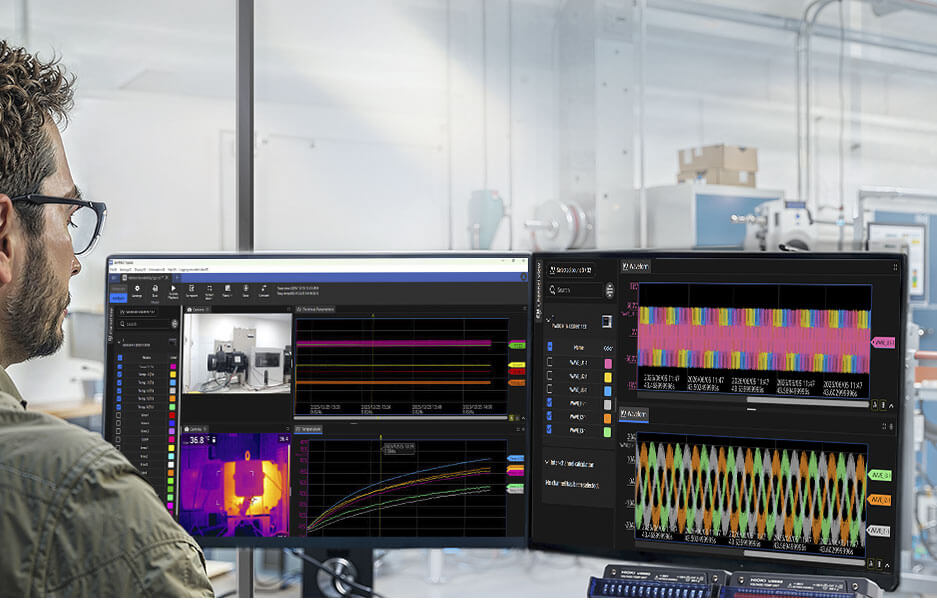
Open analysis views in separate GENNECT Space windows and place different measurement files side by side. Use a large monitor or dual-display setup to compare raw inverter voltage and current waveforms with calculated power results, review performance differences between prototypes, or check current data against previous maintenance records. When you need to explain a difference, side-by-side comparison helps make changes easier to see and easier to share.
Example applications
- Review raw inverter voltage and current waveforms together with calculated power results.
- Compare measurement data side by side to understand performance variation between prototypes.
- Display high-speed signals and multi-point temperature data in separate windows for easier review.
- Identify abnormalities by comparing them with the results from the regular maintenance six months ago.
See changing conditions at a glance
Turn changing measurement values into displays that engineers can understand quickly.
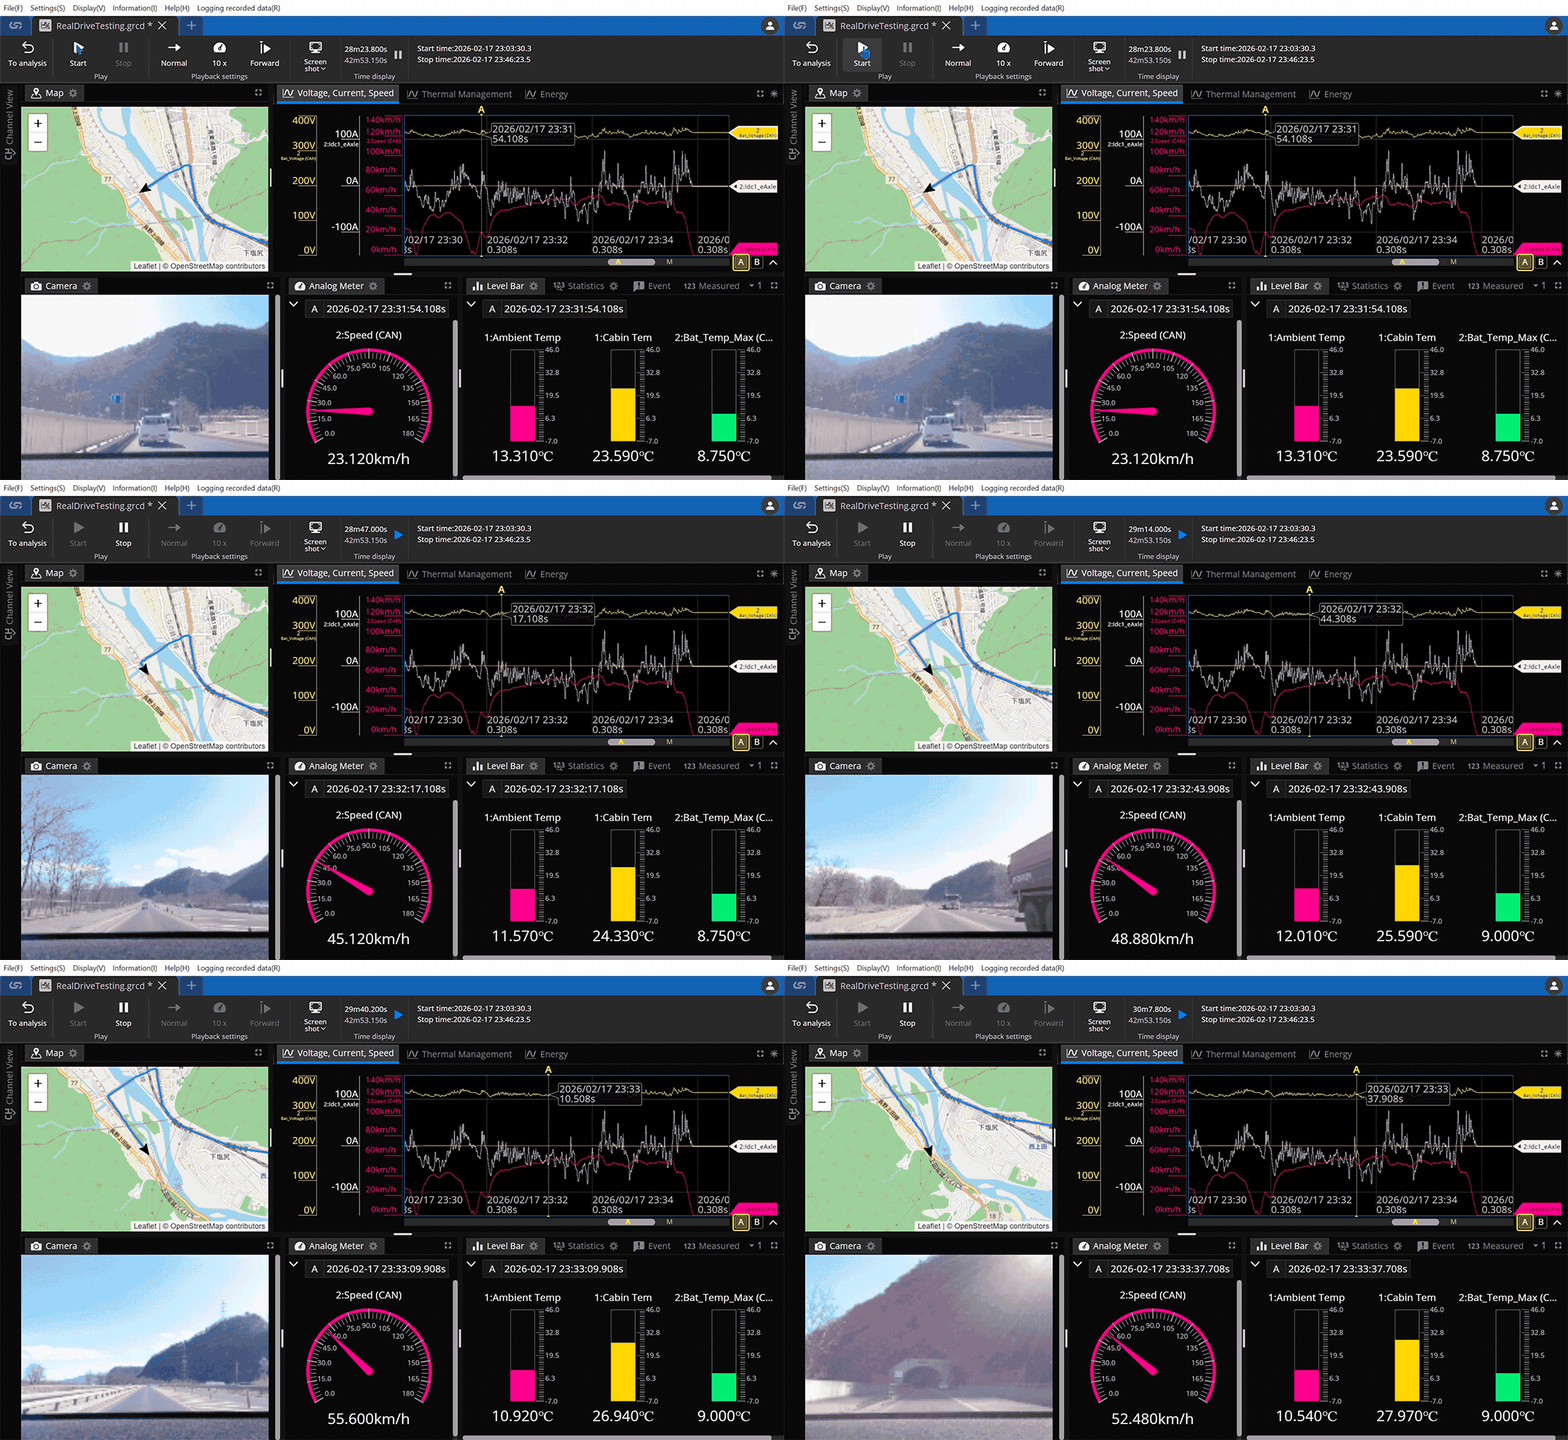
Version 1.5 adds analog meter and level bar displays to help you check measurement status without searching through long numerical lists. Use meter-style displays for values such as vehicle speed, and level bars for temperatures or other changing values.
Set thresholds to show when a value stays in the expected range or moves toward an abnormal condition. During playback, these displays help you connect data changes with what happened during the test.
These panels are especially effective when used with the data playback function in GENNECT Space. For example, a vehicle driving test can show speed on an analog meter and temperatures with level bars. This simplifies reviewing how measurements changed during the test.
Turn analysis into reports faster
Get the numbers you need for reports without spending extra time organizing data.
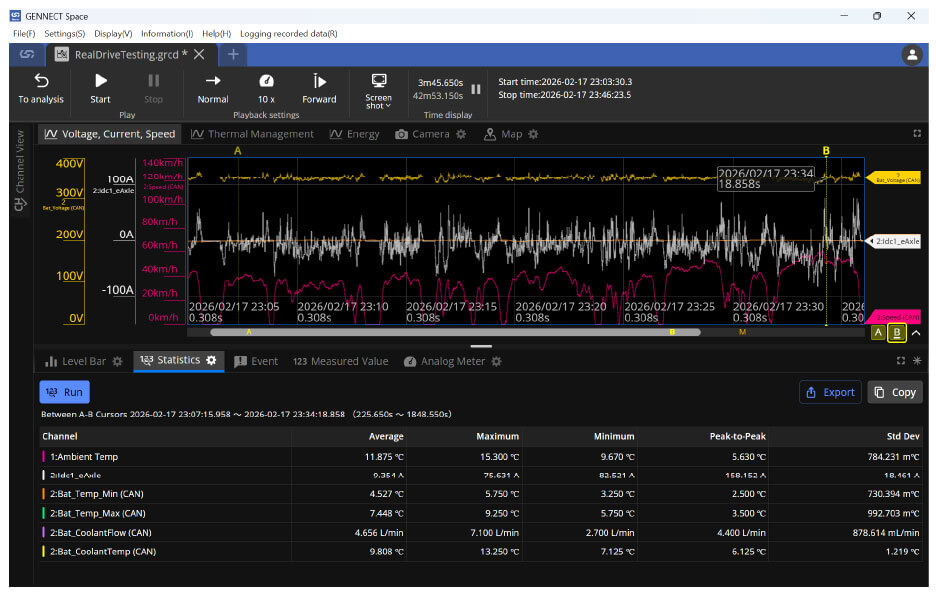
The Statistics panel calculates values such as average, maximum, minimum, and standard deviation for the full data set or for a selected range. You can export the results as CSV or copy and paste them directly into tools such as Excel.
This helps shorten the path from analysis to reports, reviews, and engineering decisions.
Keep data ready for external workflows
Move measurement data smoothly into the tools your team already uses.
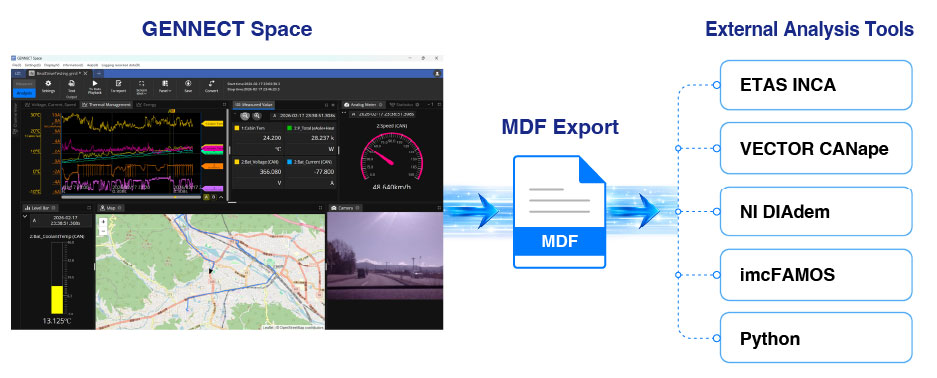
GENNECT Space V1.5 exports logging data in ASAM MDF format (.mf4), making it easier to use HIOKI measurement data in external analysis workflows. Use exported data with tools such as ETAS INCA, VECTOR CANape, NI DIAdem, imcFAMOS, and Python.
From measurement to analysis, GENNECT Space helps keep your data connected across the workflow.
Get started with GENNECT Space V1.5
Try the latest GENNECT Space V1.5 features with sample data and see how smoothly recorded data can move into review, analysis, reporting, and external workflows.
Integrating Data into One Space
Measurement Data Integration Software
GENNECT Space
Analysis software that integrates data from multiple instruments and links it to real-world events
Available on: Windows
Detailed feature list
This section introduces the detailed specifications of the features added or improved in GENNECT Space V1.5.
Panel features
Analog meter panel
Displays measurement values using arc-shaped meters and needle movement.
Target channels can be selected from the Channel View.
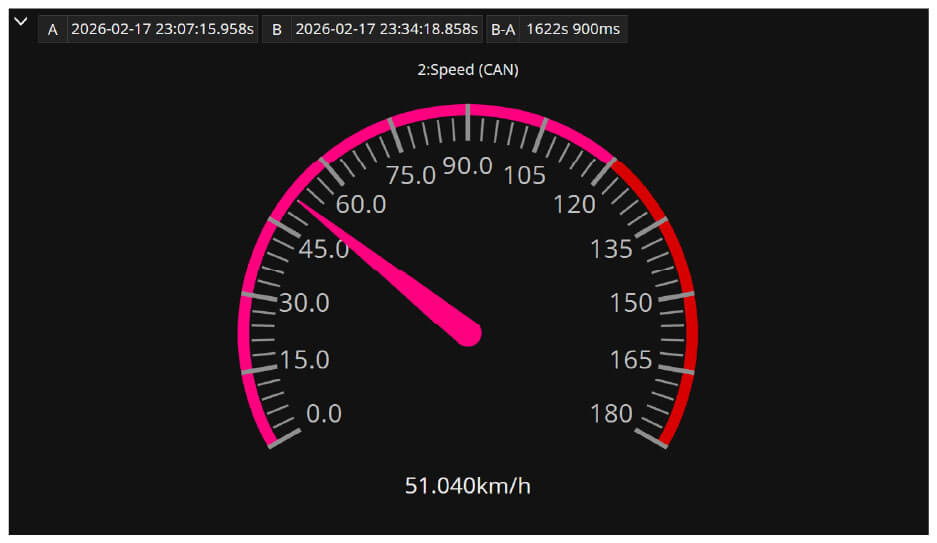
- Full-scale range setting
- Threshold setting with color changes
- User-defined thresholds or linked channel thresholds
- Up to 10 channels can be displayed in one panel
- Up to five Analog Meter panels can be placed in one workspace
Level bar panel
Displays measurement values using the length of vertical or horizontal bars.
Target channels can be selected from the Channel View.
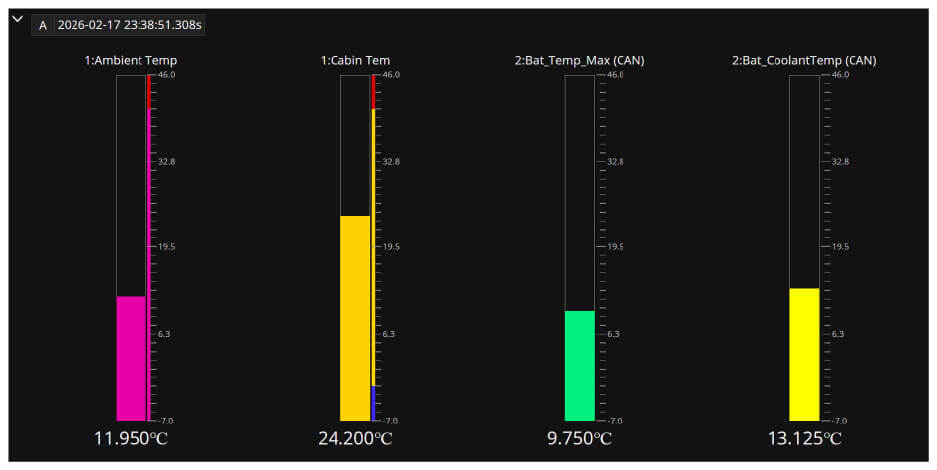
- Measurement values shown as bar length
- Warning threshold setting with color changes
- User-defined thresholds or linked channel thresholds
- Up to 10 channels can be displayed in one panel
- Up to five Level Bar panels can be placed in one workspace
Instrument waveform panel
Displays the instrument screen directly within the measurement screen.
This is useful when you want to check instantaneous waveforms from a power analyzer during logging.
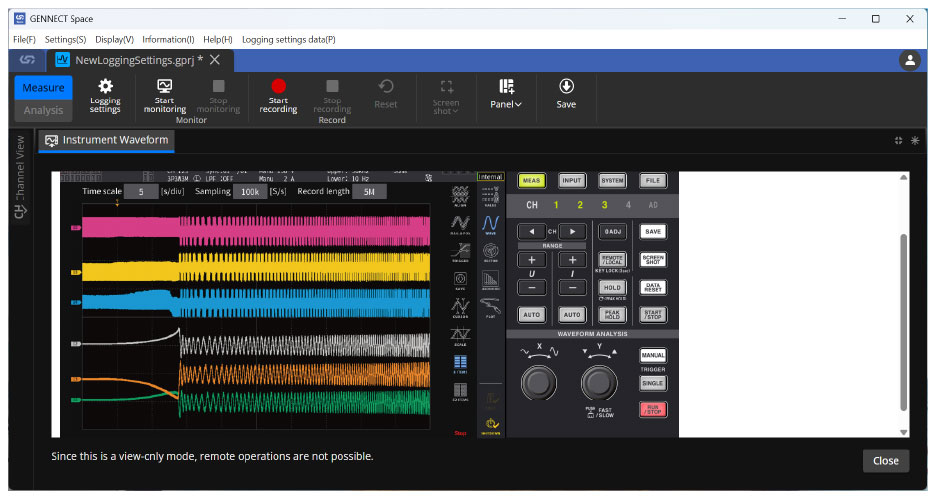
- One panel can be placed for each measuring instrument
- Up to 10 Instrument Waveform panels can be placed in one workspace
Statistics panel
Calculates and displays statistical information for the entire data set or for a range specified with A/B cursors.
Target channels can be selected from the Channel View.
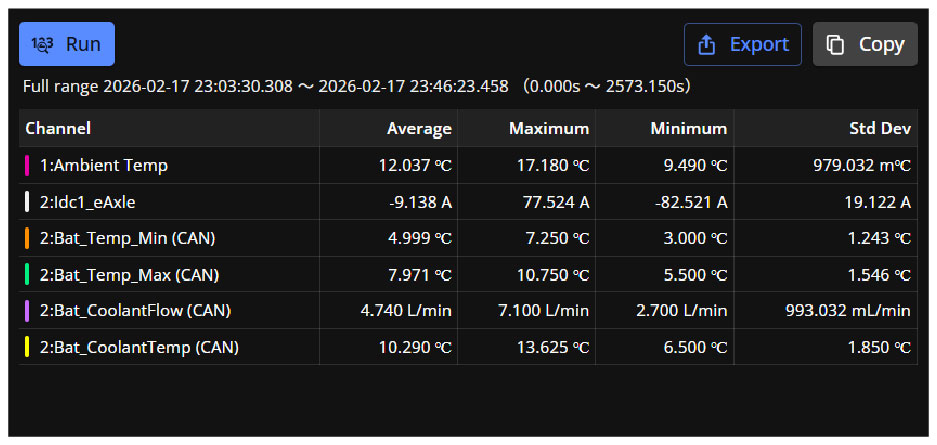
- Up to one Statistics panel can be placed in one workspace
- Displays 20 types of statistical information, including Average, Max, Min, Time of Max, Time of Min, Peak-to-Peak, ON count, OFF count, ON time, OFF time, Standard Deviation, Sum, and Integral, etc.
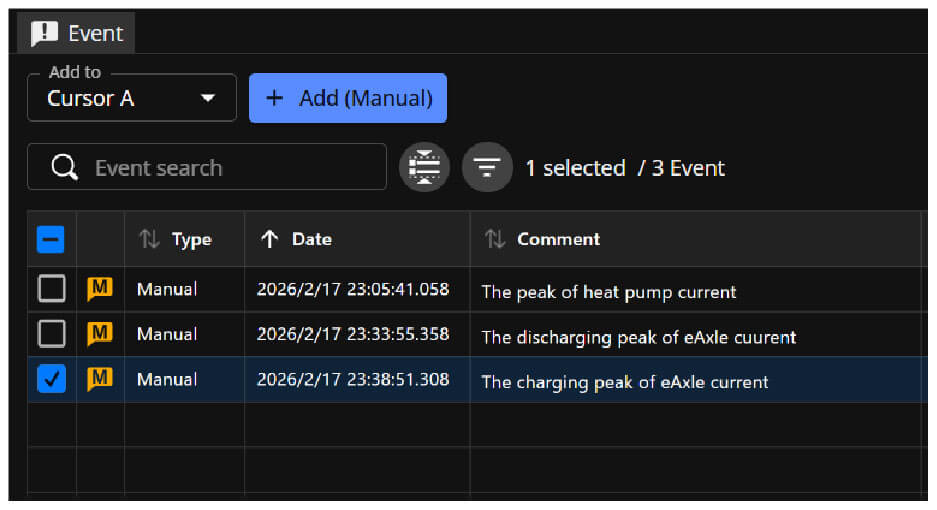
Event Panel
Add event markers to important points on a waveform and return to them quickly during review.
You can add an event marker at the position of Waveform Cursor A or B, and enter a comment for each marker. Added events appear in the Event Panel as a list. When you select an event, GENNECT Space displays the corresponding waveform position on the screen.
Import and export features
Import instrument waveform files
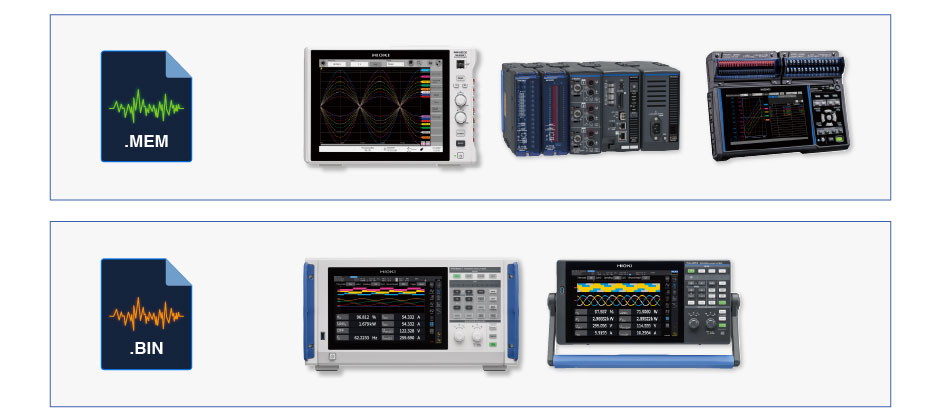
Waveform files saved in the internal memory or USB storage of a measuring instrument can be imported into GENNECT Space.
When a file is imported, instrument channel information is automatically recognized and associated with the corresponding channels in GENNECT Space.
Supported file formats:
- MR6000: Waveform files (.MEM format)
- LR8450, LR8101, LR8102: Waveform files (.MEM format)
- PW8001, PW4001: Measurement files and Waveform files (.BIN format)
Export in MDF file format
Logging data can be exported in ASAM MDF 4.2 standard format (.mf4).
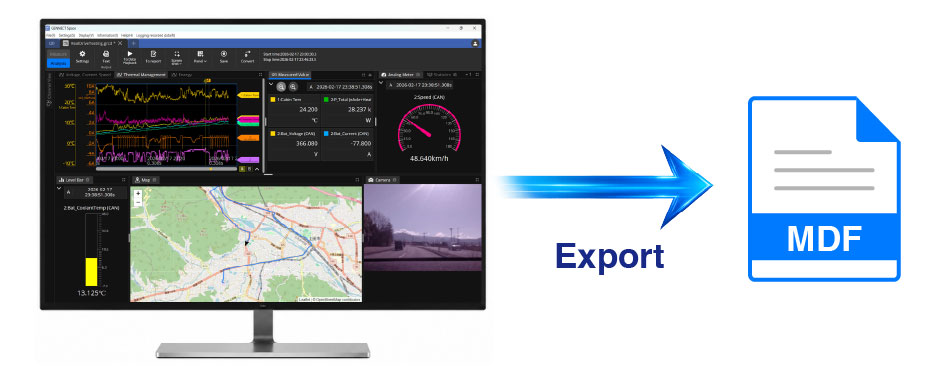
- Format: ASAM MDF 4.2, an ISO standard format
- Data type: Float64
- Metadata: Includes instrument information, channel information, and other related data
- Compatibility: Supports use with general-purpose analysis tools such as MATLAB and Python libraries
Instrument setting features
Expanded power recording intervals
GENNECT Space V1.5 supports longer recording intervals for power measurement.
For power analyzers, PW8001 and PW4001, the recording interval can be selected from the fixed list below, as long as the selected interval is a multiple of the instrument update rate.
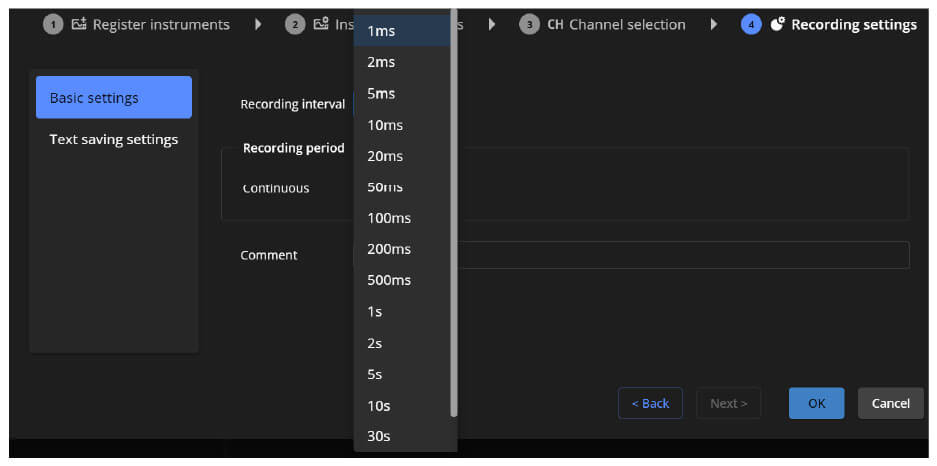
Available recording intervals:
1 ms, 5 ms, 10 ms, 50 ms, 100 ms, 200 ms, 500 ms, 1 s, 2 s, 5 s, 10 s, 30 s, 1 min
The selected recording interval cannot be shorter than the instrument update rate.
For example, when the instrument update rate is 10 ms, the available recording intervals are:
10 ms, 50 ms, 100 ms, 200 ms, 500 ms, 1 s, 2 s, 5 s, 10 s, 30 s, 1 min
Remote instrument setup
Power analyzer settings can be configured from Logging Settings > Instrument Settings.
For power analyzers, GENNECT Space displays the instrument's remote operation screen, HTTP screen, so that instrument settings can be configured from that screen.
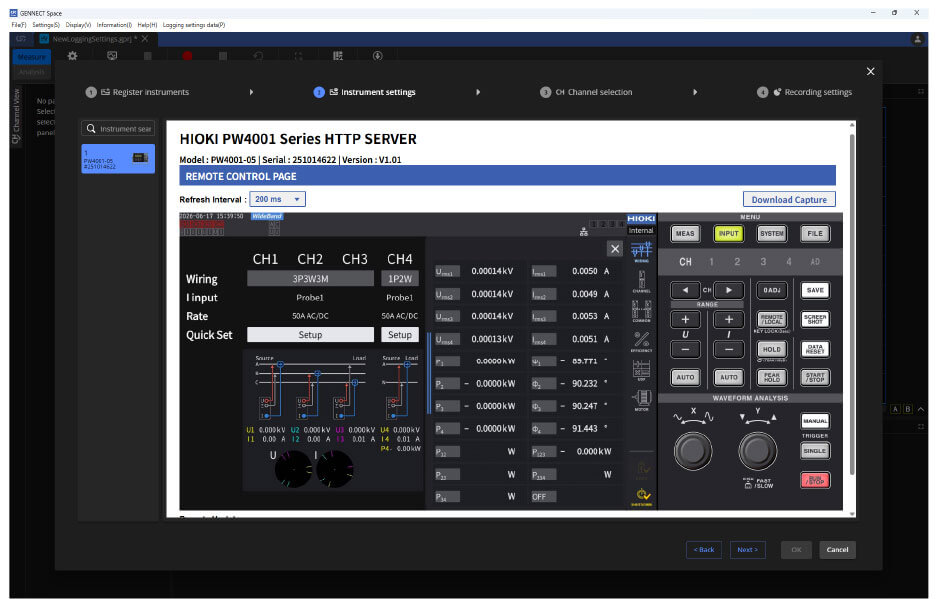
Supported instruments:
- Power analyzer PW8001, Power analyzer PW4001
- For LR8450, LR8101, and LR8102, instrument settings can be configured directly from the GENNECT Space settings screen.
What help or have questions?
GENNECT Space is continuously updated based on feedback from users.
Try the latest version and let us know what you think.