Investigation of Inverter Motor Loss Using the Power Spectrum Analysis (PSA) Function
Introduction
Recent years have seen progress in the development of high-efficiency inverters using SiC and GaN power semiconductor devices, which are capable of high-speed switching. However, only the fundamental-wave power directly contributes to the rotational force of an inverter-driven motor. This means that all high-frequency components of the fundamental wave are lost as useless energy (in the form of heat, sound, and vibration). As a result, engineers developing high-efficiency inverter motor systems focus on reducing high-frequency power loss. They need accurate power measurement data in order to analyze the factors that contribute to such losses.
This application note explains how the high-precision Power Analyzer PW8001’s Power Spectrum Analysis (PSA) function differs from harmonic analysis functions provided by typical power analyzers. Furthermore, this article will introduce how PSA can be used to estimate the loss factors in inverter motors.
The difference between harmonic analysis and FFT analysis
Figure 1 illustrates the frequency spectrum of active power output from an inverter. Power output from inverters includes the fundamental frequency (which drives the motor) and its harmonics (shown in blue), and the inverter’s carrier frequency and its harmonics (shown in yellow). Since only the fundamental frequency provides energy that drives the motor, power of other frequencies are considered as loss. Harmonic analysis and the PW8001’s Power Spectrum Analysis (which is essentially “power FFT”) are both used in frequency analysis of power loss, but for different purposes. Harmonic analysis is suited to analyzing low-frequency domains (including the fundamental frequency) while FFT analysis is suited to analyzing high-frequency carrier frequency components. Let’s examine how these two types of analyses differ.
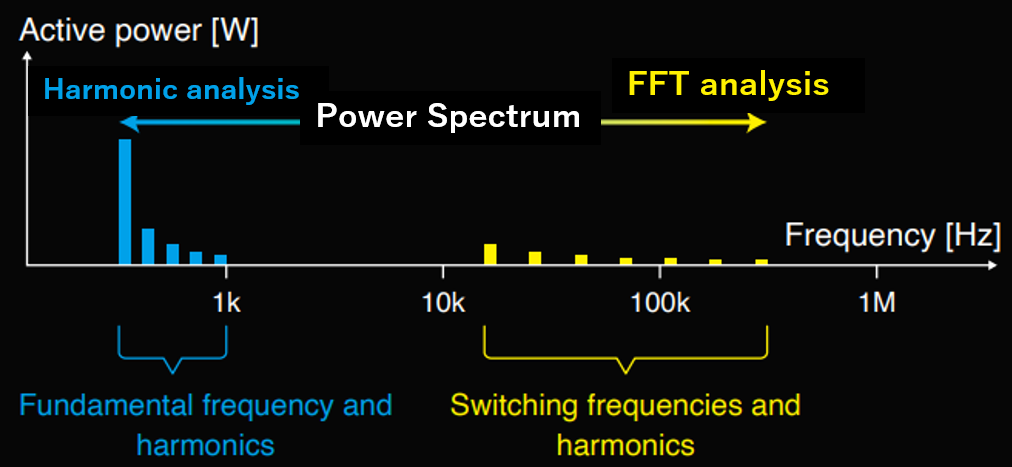 Fig. 1: Frequency spectrum of active power output from an inverter
What is fast Fourier transform (FFT) analysis?
FFT analysis converts a signal into its frequency components and displays a spectrum indicating the strengths of those components.
Since FFT analysis displays the current and voltage of all frequency components (not just harmonics), this makes it uniquely suited to analyzing an inverter’s carrier frequency (switching frequency) which is not related to the motor’s rotational speed. Since the carrier frequency remains constant at all times, one can intuitively and continuously assess fluctuations in voltage and current on the frequency axis.
Power Spectrum Analysis (PSA) function of the high-precision Power Analyzer PW8001
The PW8001 provides the Power Spectrum Analysis (PSA) function, an FFT analysis of active power . It is an evolution of the traditional FFT that analyzes voltage and/or current. But why isn’t this FFT of power standard in the market? And why is it a function that Hioki can supply the world with such confidence? The answer to both of these questions lies in phase characteristics. Since conventional measuring instruments’ phase characteristics are not good enough to reliably measure power in high frequencies, analyzing power on the spectrum axis becomes impractical. For example, if a current sensor has bad high frequency characteristics, the FFT power spectrum of the inverter-driven motor may be measured as negative. This is because the phase error in high frequencies is too great that it negatively affects the multiplication of current and voltage into power. In this way, even though frequency analysis of current or voltage may be fine, the frequency characteristics of current sensors or measuring instruments results in unreliable FFT analysis of high frequency power. However, the PW8001 has excellent phase characteristics and works in tandem with Hioki’s current sensors with also top-of-the-market phase characteristics. This enables the highly accurate, wideband active-power FFT analysis that is Power Spectrum Analysis (PSA). Furthermore, Hioki’s signature synergy between advanced measuring instruments and current sensors enables automatic recognition of the sensor and automatic Phase Shift correction of high-frequency phase error. This ensures easy and quick phase correction, void of human error.
The PSA is a new function provided with confidence by Hioki. This FFT analysis of active power is specially suited for high-frequency power loss analysis. It was made available with the PW8001’s firmware update Version 2.0. Table 1 provides a specification overview of the PW8001’s Power Spectrum Analysis (PSA) function.
Table 1: specification overview of the Power Spectrum Analysis (PSA) function
| Item | Specifications |
|---|---|
| Measurement channels |
|
| Calculation type |
|
| Number of possible FFT points | 1,000/5,000/10,000/50,000/100,000/500,000/1,000,000/5,000,000 |
| Anti-aliasing | Digital filter is applied automatically |
| Window function | Rectangular, hamming, flat top |
| Maximum analysis frequency |
|
Using Power Spectrum Analysis to estimate factors that contribute to inverter-motor loss
The Power Spectrum Analysis function makes it possible to analyze loss factors that cannot be assessed by typical power analyzers’ harmonic analysis capabilities. Consider the following example of measuring harmonic power loss in an inverter-driven motor.
Harmonic power loss in an inverter-driven motor
It is known that when a permanent magnet synchronous motor or induction motor is driven by an inverter, motor core loss increases due to the effects of harmonic currents caused by switching. Similarly, if square wire is used for a coil, unbalanced current in the wire causes increased core loss when the motor operates at high speeds. By observing high-frequency power values that don’t help drive the motor and the associated frequency distribution in real time, it’s possible to develop an intuitive understanding of how changes in the motor’s rotational speed and torque conditions affect high-frequency power loss. This technique can provide important clues in loss factor analysis so that high-frequency power losses such as core loss and AC copper loss can be isolated from mechanical losses in motor design.
Figure 2 shows harmonic power loss in an inverter motor drive waveform being observed on the PW8001’s Power Spectrum Analysis (PSA) function screen. In this example, the PW8001’s Power Spectrum Analysis was performed on a 3-phase inverter's output waveforms with a carrier frequency of 16 kHz. This allows you to observe the carrier frequency and its associated harmonic power spectrum. On the same screen, you can check specific spectrum frequencies and power values, which are presented as a “Top 10” list. Furthermore, you can save all data as a CSV file for use in detailed analysis.
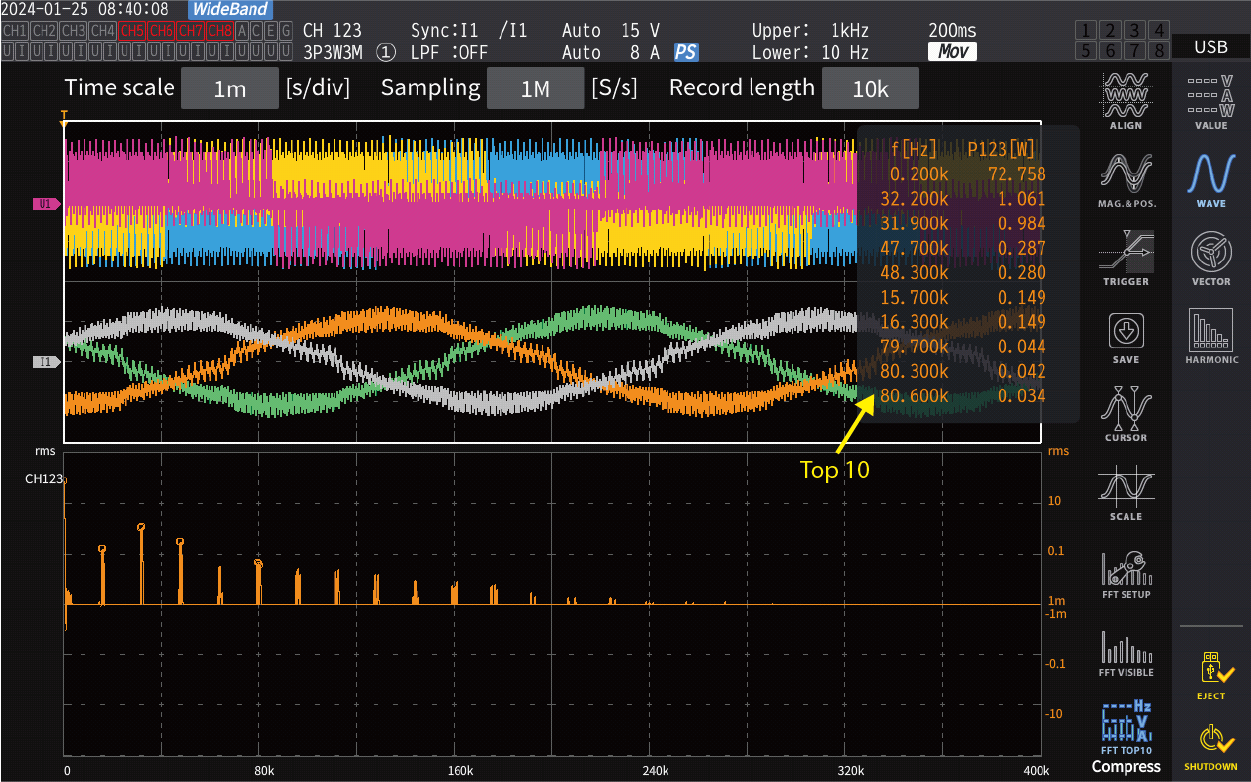 Fig. 2: Power Spectrum Analysis (PSA) function’s display
Conclusion
Thanks to current sensors with outstanding frequency characteristics and automatic phase correction technology, the Power Analyzer PW8001 offers valuable capabilities for evaluating inverter-motor performance. This allows the power analyzer to yield accurate, wideband measurement results while providing quick insights into high-frequency power loss via its Power Spectrum Analysis function. Hioki invites engineers working to achieve power conversion efficiency improvements on the order of 0.1% to try the instrument, which is uniquely able to aid in the investigation of power loss.
For comprehensive details on our products, explore the PW8001 product page. If you are interested in a demonstration or need guidance for a specific application, do not hesitate to get in touch with us. We are here to help tailor solutions to your needs.